Fig. 1.
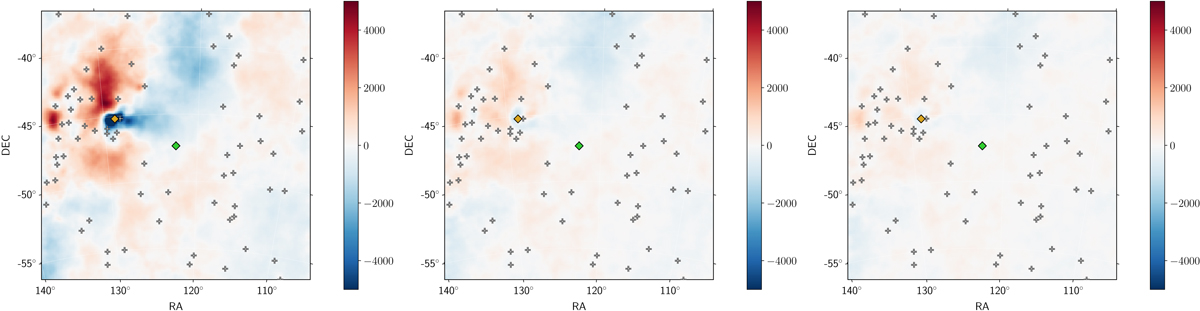
Residuals of ROI in counts from the binned maximum-likelihood fit of the non-gated dataset (left), gated dataset (centre), and off-peak dataset (right). Positions of all sources are represented with white crosses, while the green and yellow diamonds indicate the position of γ2 Velorum and the Vela pulsar, respectively. The residual for the non-gated dataset at the position of Vela is saturated for visualisation purposes of the rest of the ROI, in some some pixels reaching almost 5 × 10⁴ counts.
Current usage metrics show cumulative count of Article Views (full-text article views including HTML views, PDF and ePub downloads, according to the available data) and Abstracts Views on Vision4Press platform.
Data correspond to usage on the plateform after 2015. The current usage metrics is available 48-96 hours after online publication and is updated daily on week days.
Initial download of the metrics may take a while.