Free Access
Fig. 5.
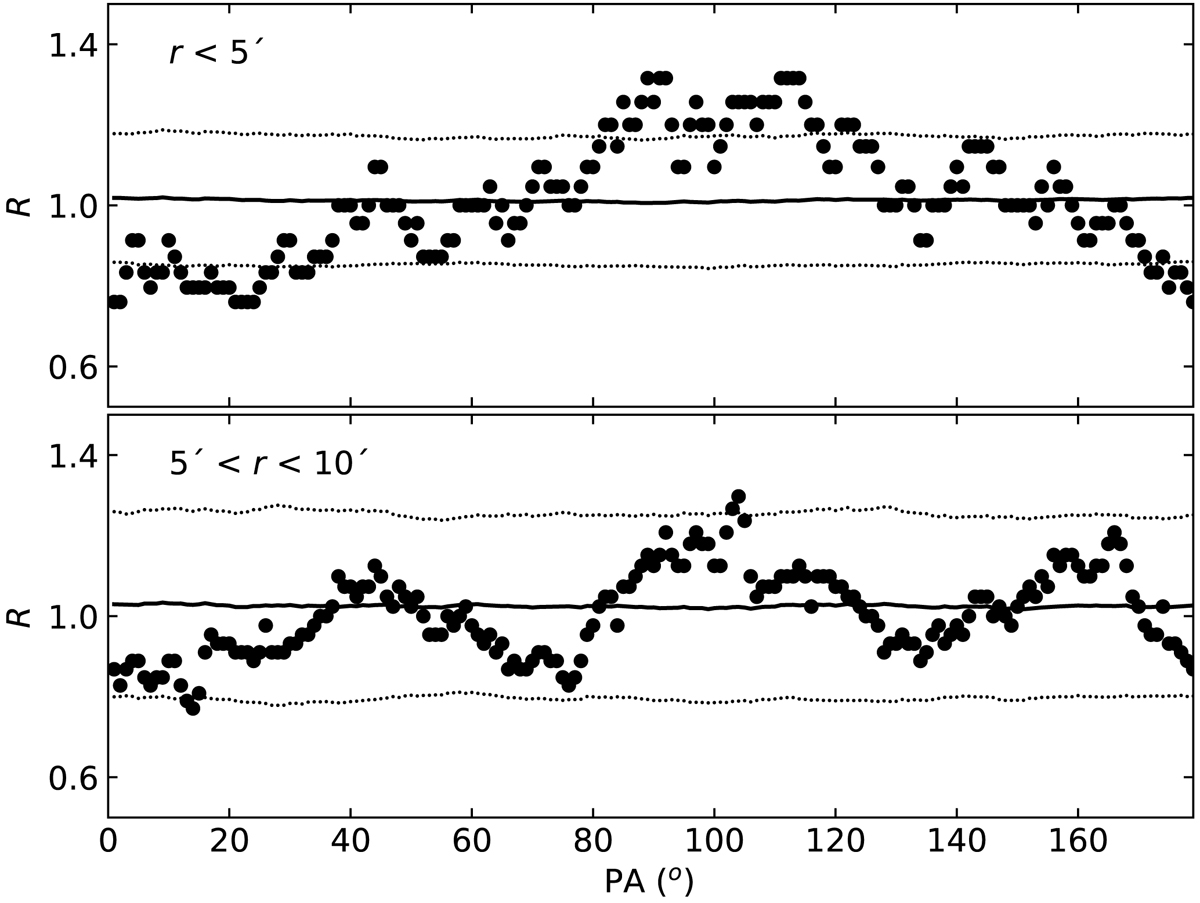
Ratio ![]() (see Sect. 4 for detais) versus PA obtained from star counts in the star-field-cleaned MS strip (large filled circles). Solid and dotted lines represent the resulting mean and dispersion of the Monte Carlo simulations, respectively.
(see Sect. 4 for detais) versus PA obtained from star counts in the star-field-cleaned MS strip (large filled circles). Solid and dotted lines represent the resulting mean and dispersion of the Monte Carlo simulations, respectively.
Current usage metrics show cumulative count of Article Views (full-text article views including HTML views, PDF and ePub downloads, according to the available data) and Abstracts Views on Vision4Press platform.
Data correspond to usage on the plateform after 2015. The current usage metrics is available 48-96 hours after online publication and is updated daily on week days.
Initial download of the metrics may take a while.