Fig. 3.
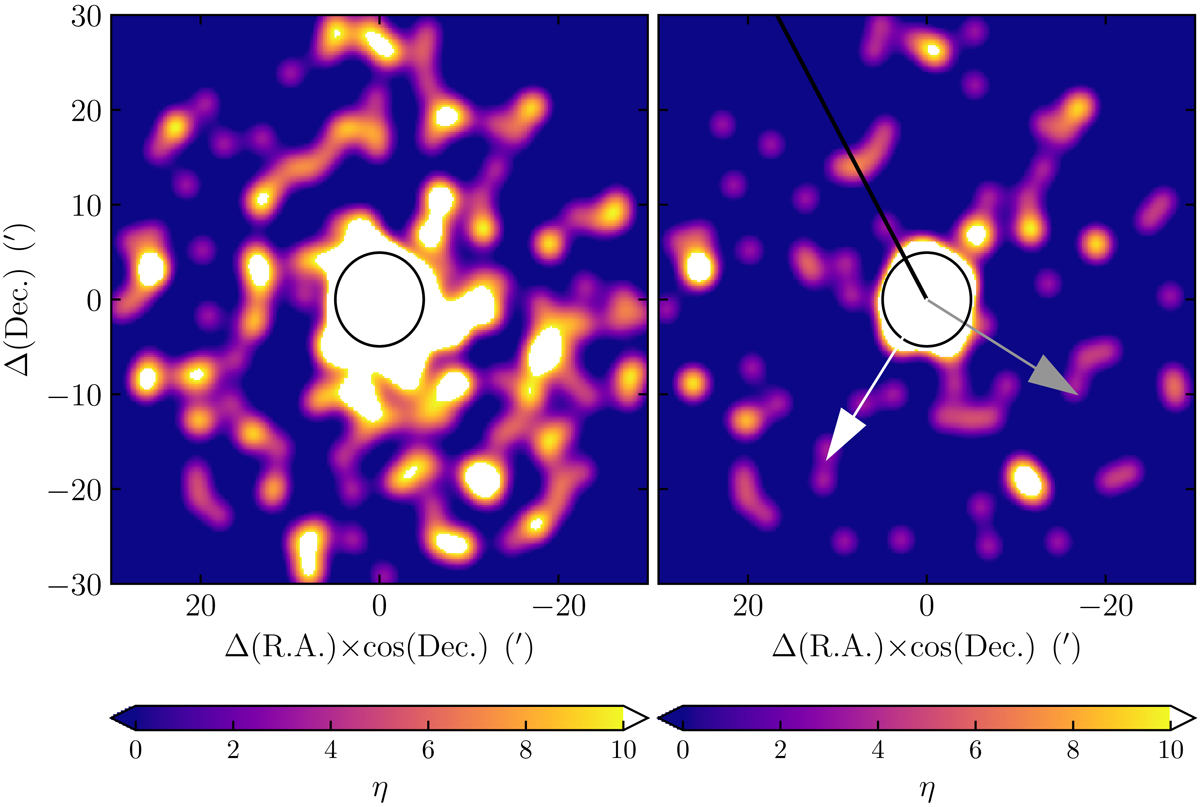
Observed (left panel) and field-star-cleaned (right panel) stellar density maps, built from stars that occupy the MS strip defined in Fig. 2. The black circle centered on the cluster indicates the assumed tidal radius Baumgardt et al. (2019; 4.94′). The different arrows indicate the directions of the cluster proper motion (gray) and of the Galactic center (white). The black line represents the cluster orbit computed with GravPot16.
Current usage metrics show cumulative count of Article Views (full-text article views including HTML views, PDF and ePub downloads, according to the available data) and Abstracts Views on Vision4Press platform.
Data correspond to usage on the plateform after 2015. The current usage metrics is available 48-96 hours after online publication and is updated daily on week days.
Initial download of the metrics may take a while.