Fig. 7.
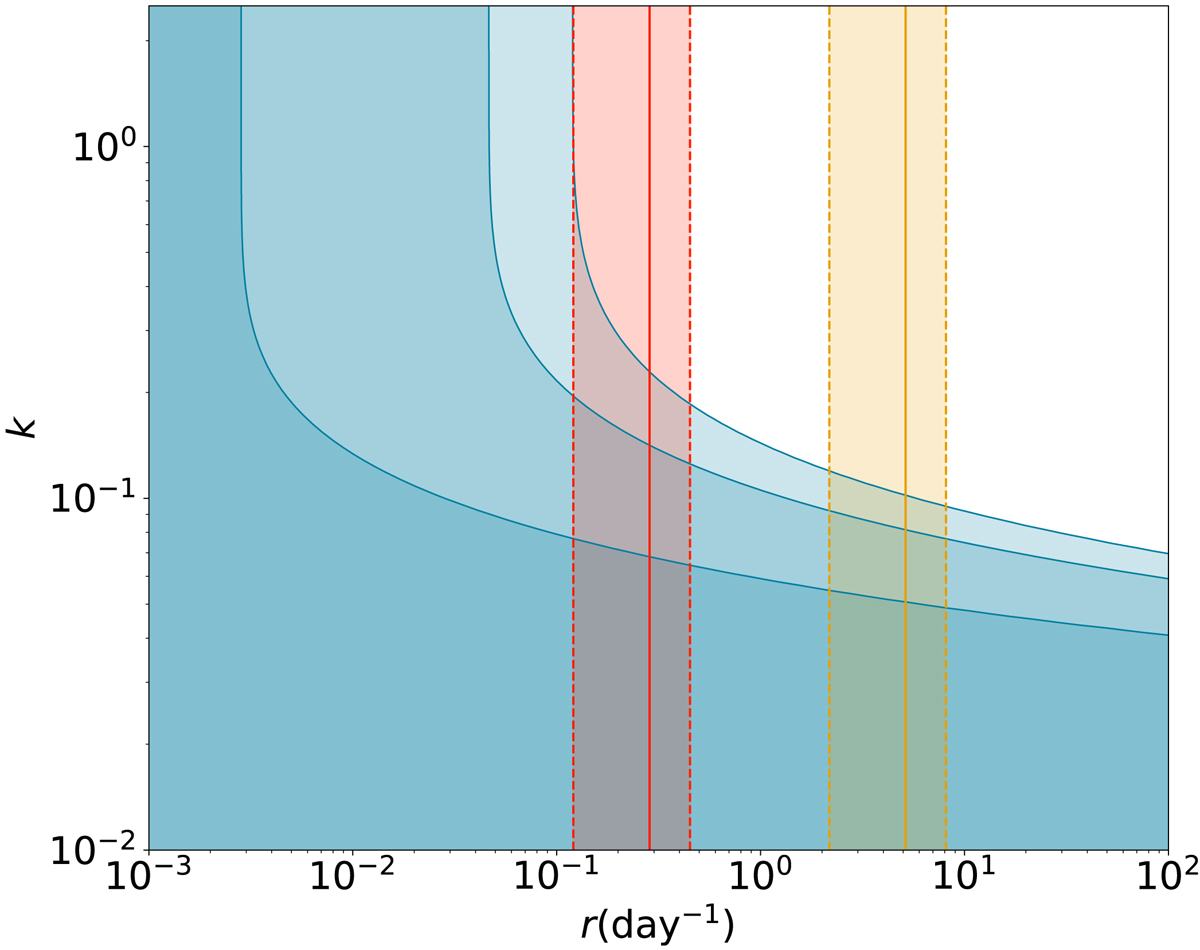
Posterior distribution of R2 burst rate and shape parameters. The blue contours indicate 1, 2, and 3σ upper limits on r and k. A lower k indicates a higher degree of clustering. The yellow region indicates the CHIME rate with Poissonian error bars. The red region is the CHIME rate modified by a spectral index of −3.6, where the CHIME lower limit on the rate matches the Apertif upper limit at k = 1, i.e. under the assumption of Poissonian statistics.
Current usage metrics show cumulative count of Article Views (full-text article views including HTML views, PDF and ePub downloads, according to the available data) and Abstracts Views on Vision4Press platform.
Data correspond to usage on the plateform after 2015. The current usage metrics is available 48-96 hours after online publication and is updated daily on week days.
Initial download of the metrics may take a while.