Fig. 6.
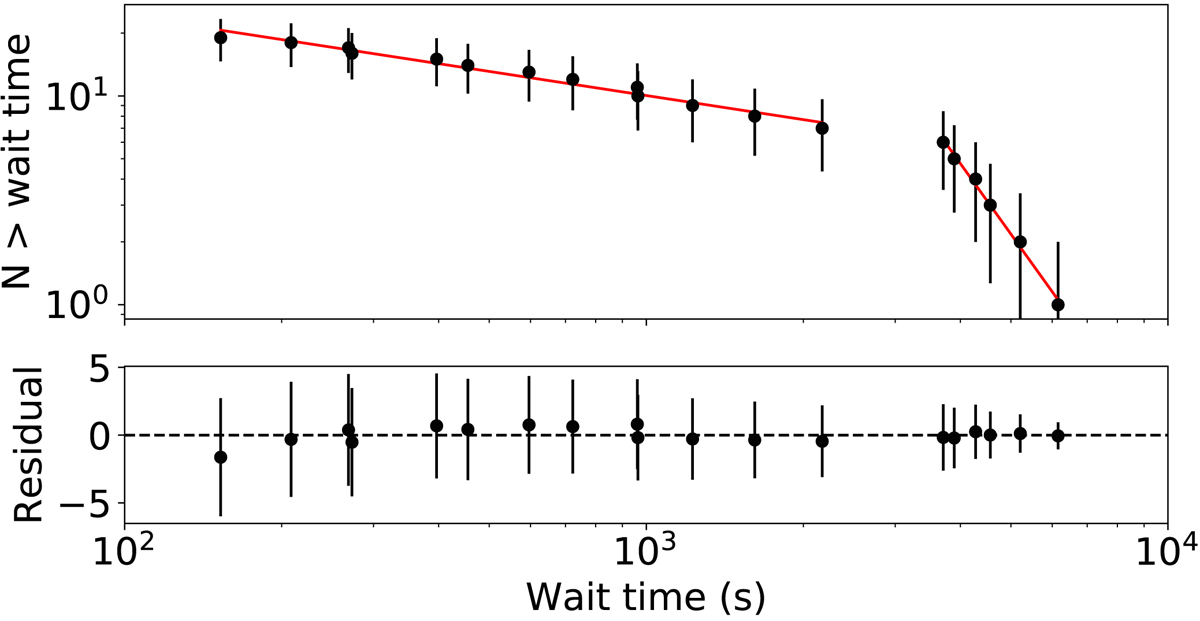
Wait time distribution of R1 bursts as detected by Apertif. Error bars are 1σ Poissonian uncertainties. The distribution is bi-modal. The lower part can be fitted by a power-law with slope −0.38(2), but does not fit an exponential distribution. The higher part can be fitted by either an exponential distribution or a power law with slope −3.5(1). For both parts, the power-law fit is shown.
Current usage metrics show cumulative count of Article Views (full-text article views including HTML views, PDF and ePub downloads, according to the available data) and Abstracts Views on Vision4Press platform.
Data correspond to usage on the plateform after 2015. The current usage metrics is available 48-96 hours after online publication and is updated daily on week days.
Initial download of the metrics may take a while.