Fig. 9.
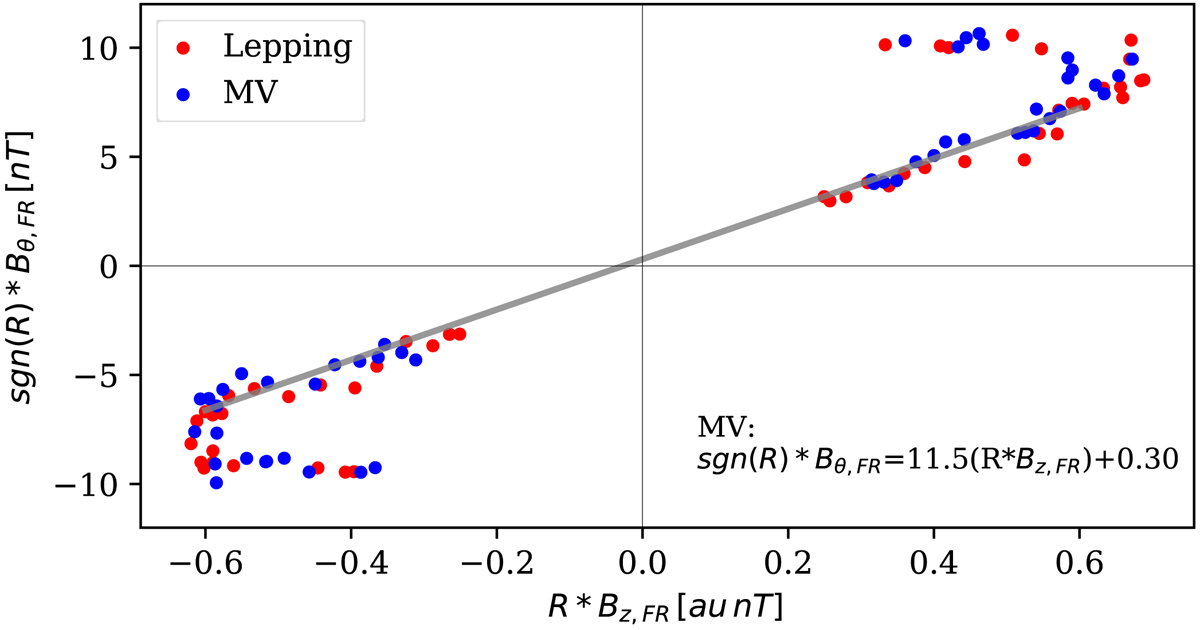
Scatter plot of sgn(R)Bθ, FR as a function of RBz,FR using the median profiles of the SEA of Fig. 6. The variable R is considered negative in the inbound and positive in the outbound in order to separate the two regions. The grey line corresponds to the linear least square fit for the MV (blue points) in the range −0.06 au < R < 0.06 au. The y-intercept (y0 = 0.3) can be approximated to zero, so that the slope of the linear fit approximates to the twist.
Current usage metrics show cumulative count of Article Views (full-text article views including HTML views, PDF and ePub downloads, according to the available data) and Abstracts Views on Vision4Press platform.
Data correspond to usage on the plateform after 2015. The current usage metrics is available 48-96 hours after online publication and is updated daily on week days.
Initial download of the metrics may take a while.