Fig. 5.
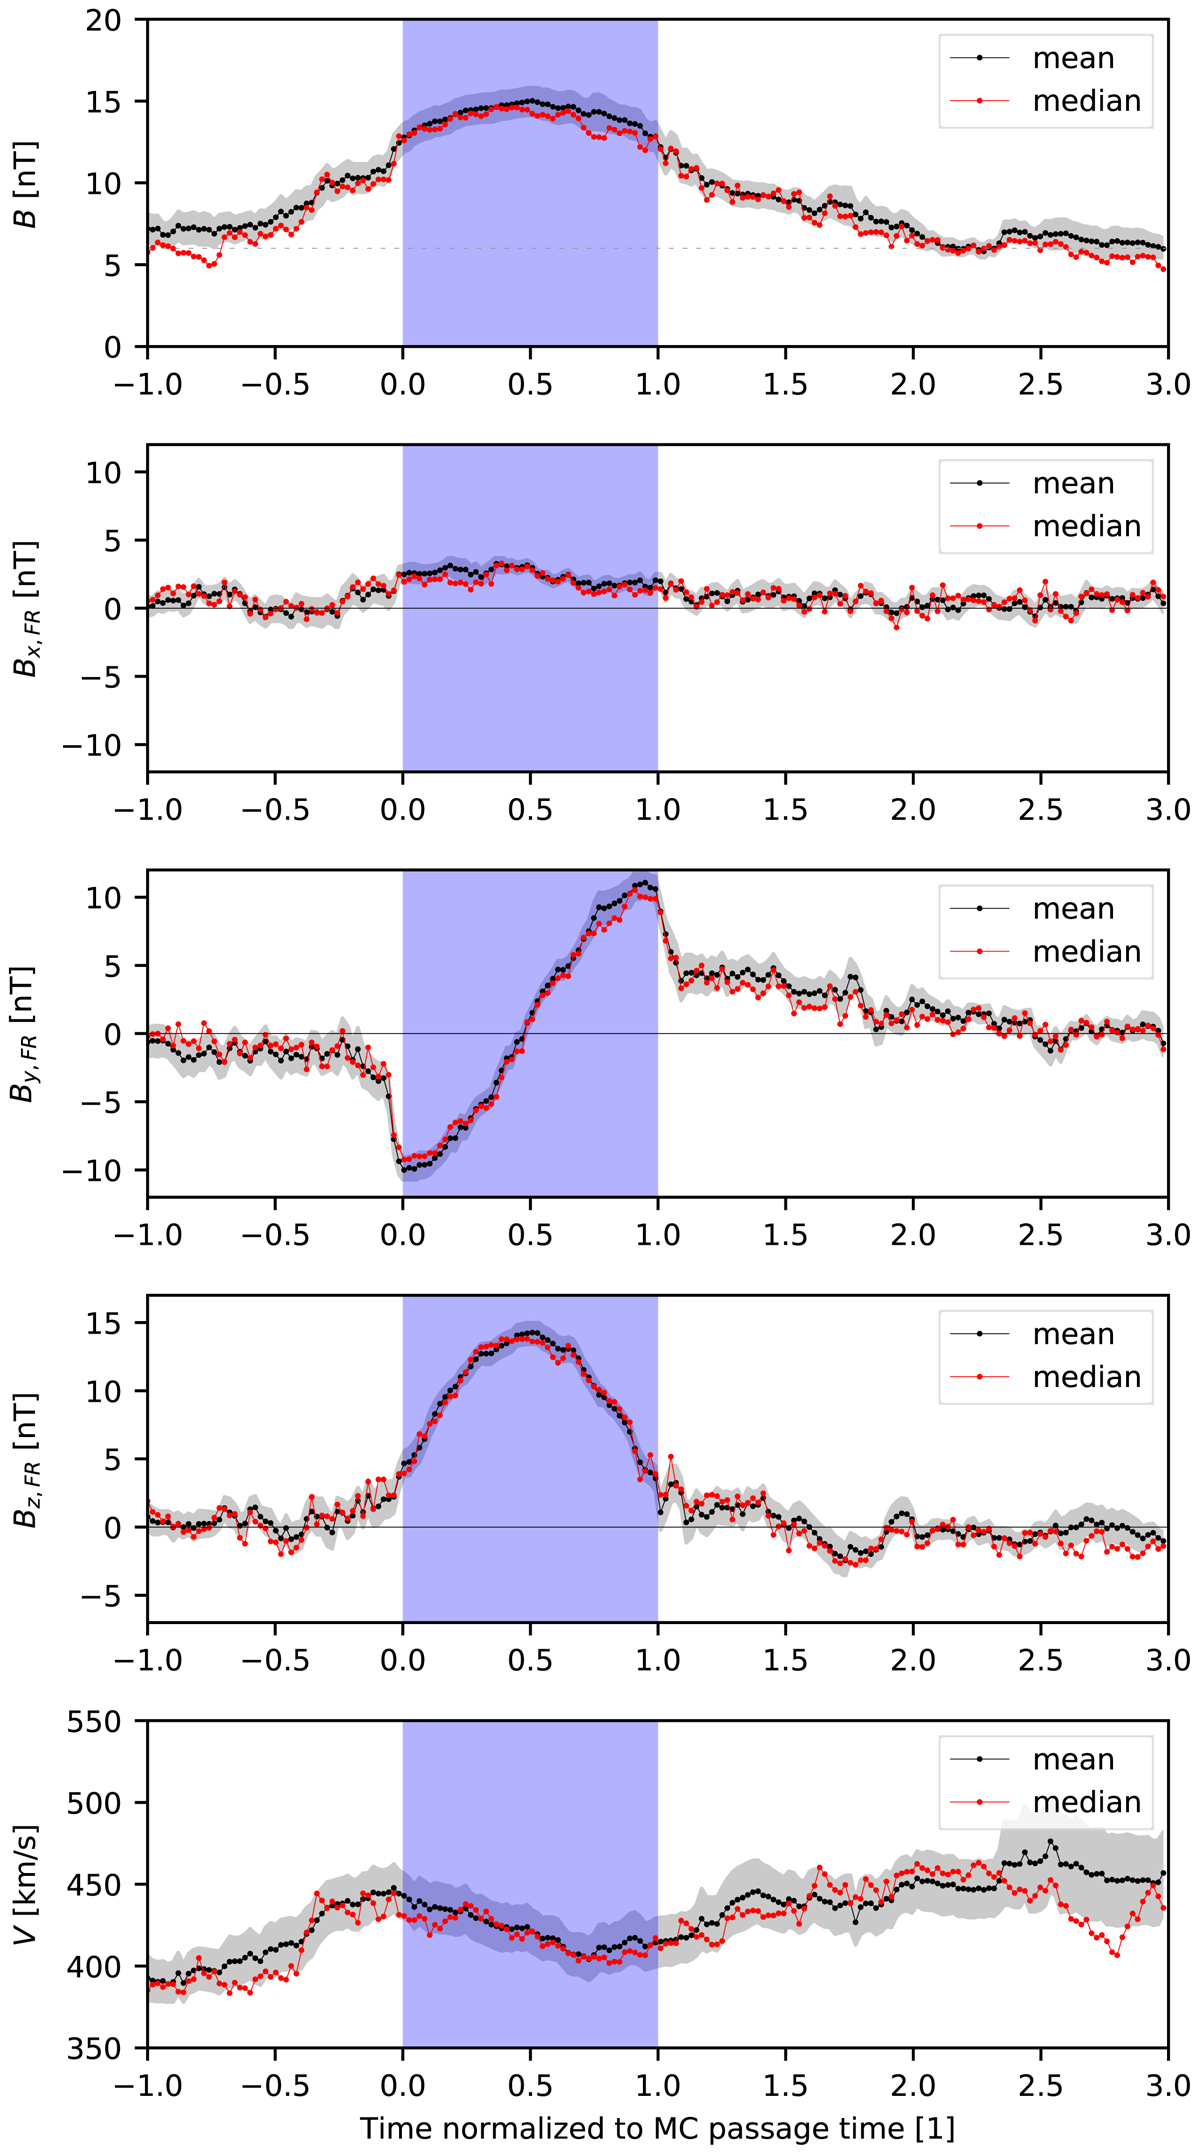
Superposed epoch profile of the magnetic field (B and components) in FR frame with the Lepping orientation, and the plasma velocity (at the bottom). The profiles were computed using the mean (black) or the median (red) of the selected MCs (Qbest sample) in each temporal bin. The grey bands show the standard deviation of the mean. The MC region is shown with a blue background. The dashed line in the upper plot corresponds to B = 6 nT associated with the ambient solar wind. The time is normalised by the MC duration (tstart = 0, tend = 1).
Current usage metrics show cumulative count of Article Views (full-text article views including HTML views, PDF and ePub downloads, according to the available data) and Abstracts Views on Vision4Press platform.
Data correspond to usage on the plateform after 2015. The current usage metrics is available 48-96 hours after online publication and is updated daily on week days.
Initial download of the metrics may take a while.