Free Access
Fig. 2.
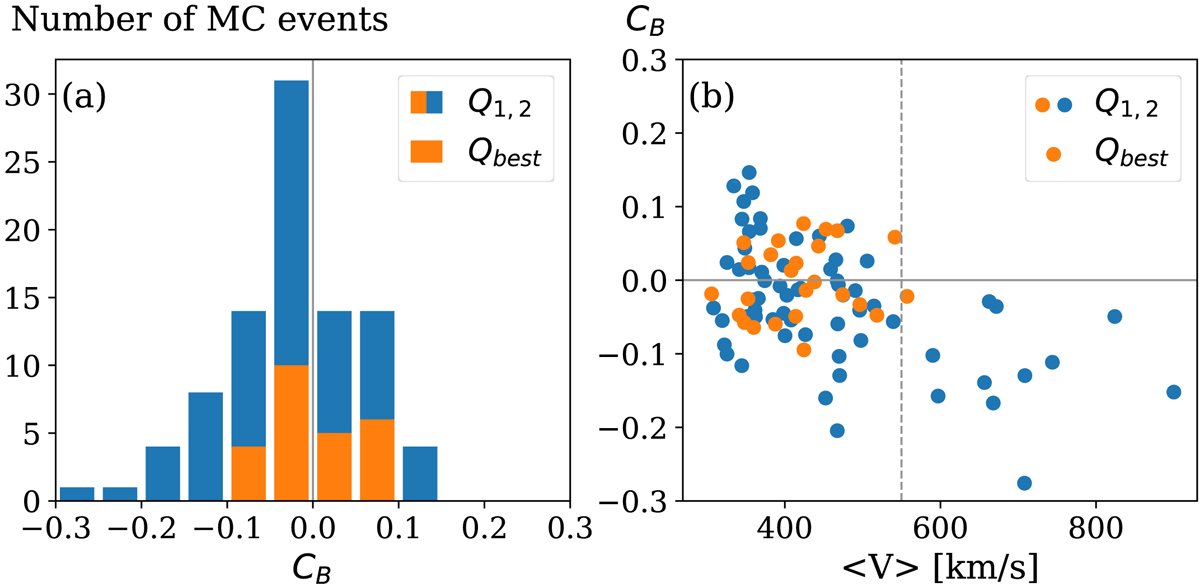
(a) Histogram of the magnetic field asymmetry CB defined by Eq. (1) and (b) scatter plot of CB vs. the mean MC velocity ⟨V⟩. The group with Q1,2 has 91 MCs and the group with Qbest has 25 MCs (included in Q1,2). The dashed line in (b) corresponds to ⟨V⟩ = 550 km s−1.
Current usage metrics show cumulative count of Article Views (full-text article views including HTML views, PDF and ePub downloads, according to the available data) and Abstracts Views on Vision4Press platform.
Data correspond to usage on the plateform after 2015. The current usage metrics is available 48-96 hours after online publication and is updated daily on week days.
Initial download of the metrics may take a while.