Fig. 10.
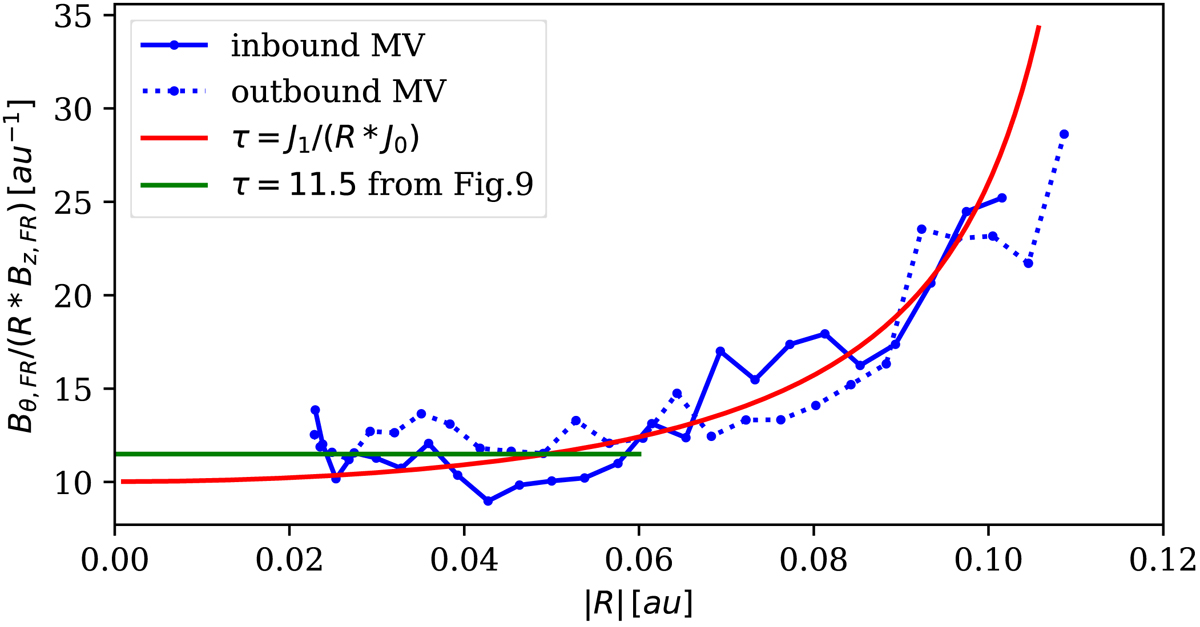
Twist as a function of the radius R computed from different methods. The blue lines (continuous and dashed) are the results derived from the median profiles of the SEA computed with FR orientation defined by the MV method. The red line is the Lundquist model fitted to the same SEA data (Fig. 7), and the green line is the twist derived from the least-squares fit of a straight line in the FR core (Fig. 9).
Current usage metrics show cumulative count of Article Views (full-text article views including HTML views, PDF and ePub downloads, according to the available data) and Abstracts Views on Vision4Press platform.
Data correspond to usage on the plateform after 2015. The current usage metrics is available 48-96 hours after online publication and is updated daily on week days.
Initial download of the metrics may take a while.