Fig. 1.
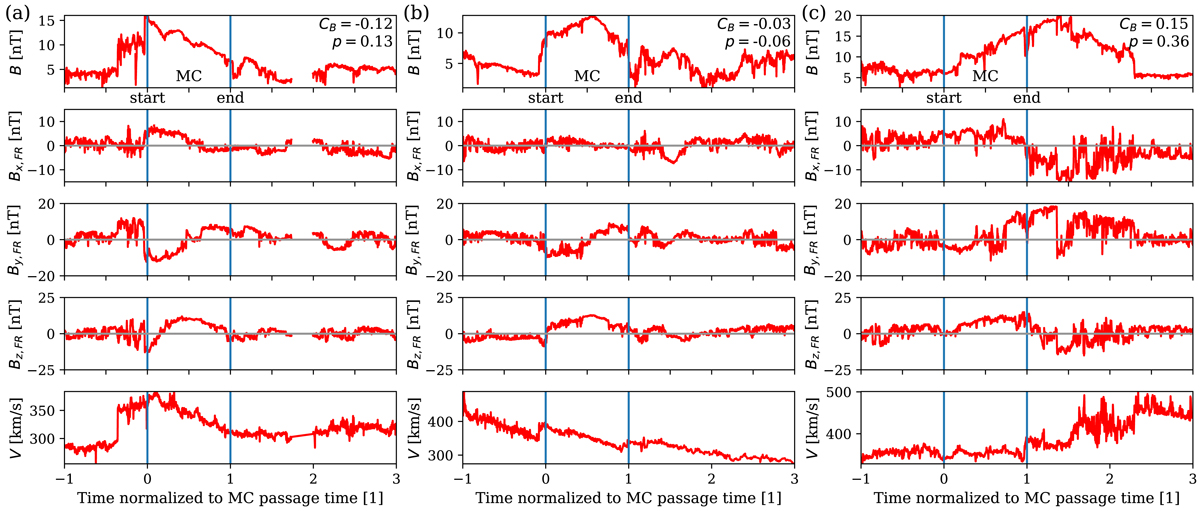
Example of three MC profiles illustrating the variety of the observed asymmetric profiles of B(t) for a comparable velocity magnitude. (a) 1 November 2012, (b) 4 March 1998, and (c) 3 September 2002. From top to bottom, the panels show the magnetic field magnitude (B), its components (Bx,FR, By,FR, Bz,FR) in the FR frame (Fig. A.1), and the plasma velocity V. The time axis is normalised with the MC boundaries: tstart = 0 and tend = 1.
Current usage metrics show cumulative count of Article Views (full-text article views including HTML views, PDF and ePub downloads, according to the available data) and Abstracts Views on Vision4Press platform.
Data correspond to usage on the plateform after 2015. The current usage metrics is available 48-96 hours after online publication and is updated daily on week days.
Initial download of the metrics may take a while.