Fig. 2.
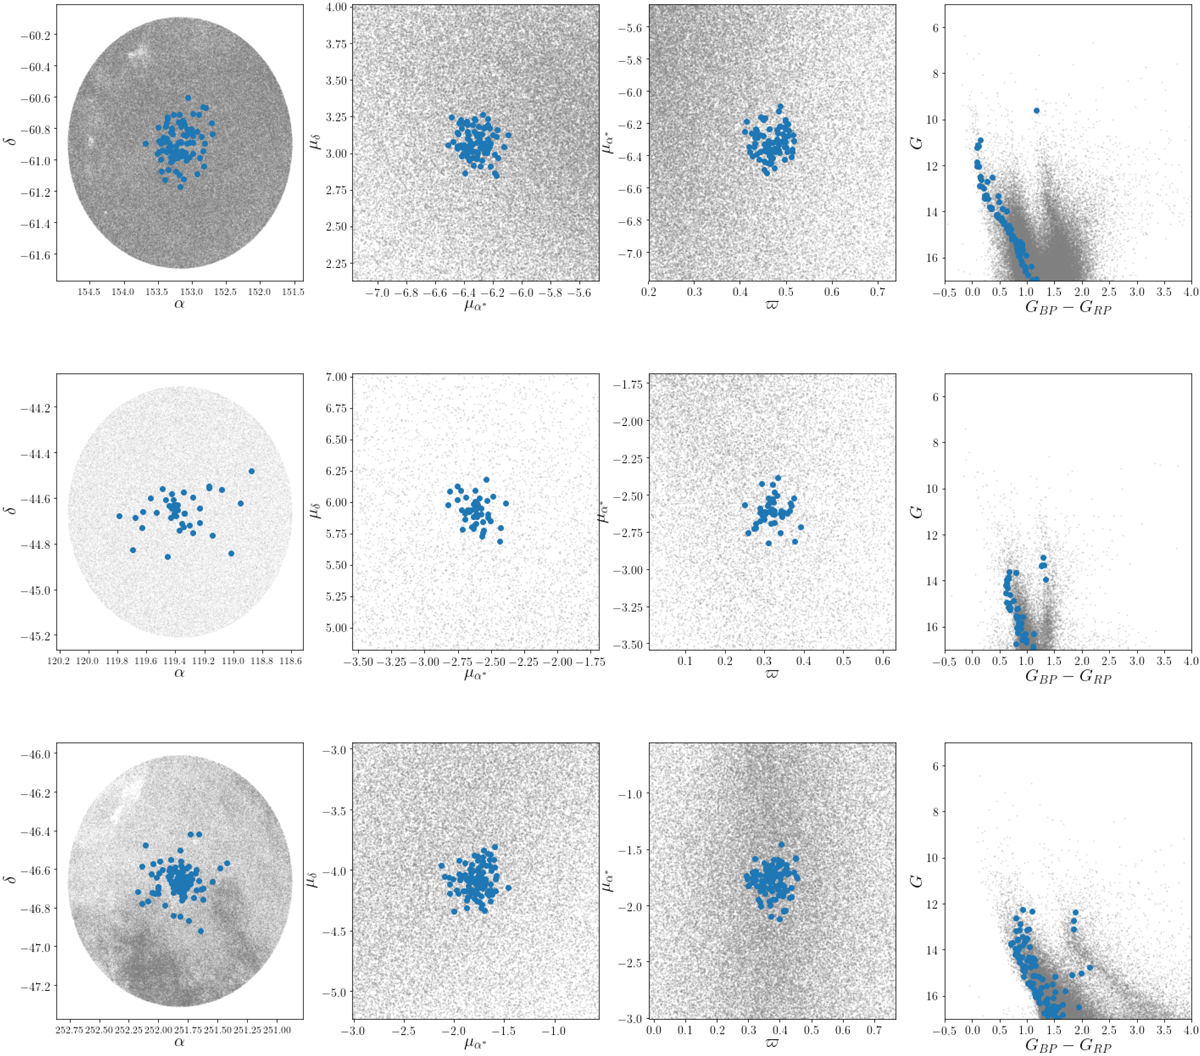
Examples of class A (top row), class B (middle row), and class C (bottom row) clusters. The columns represent, from left to right, a distribution of the member stars (in blue) and field stars (grey) for: i) position in (α, δ), ii) proper motions in (μα*, μδ), iii) distribution in (ϖ,μα*), and iv) a CMD in G vs. GBP − GRP. Rows correspond to OCs UBC 257, UBC 478, and UBC 669, respectively. Classes A, B, and C correspond to different levels of reliability (see Sect. 4.2).
Current usage metrics show cumulative count of Article Views (full-text article views including HTML views, PDF and ePub downloads, according to the available data) and Abstracts Views on Vision4Press platform.
Data correspond to usage on the plateform after 2015. The current usage metrics is available 48-96 hours after online publication and is updated daily on week days.
Initial download of the metrics may take a while.