Fig. 1.
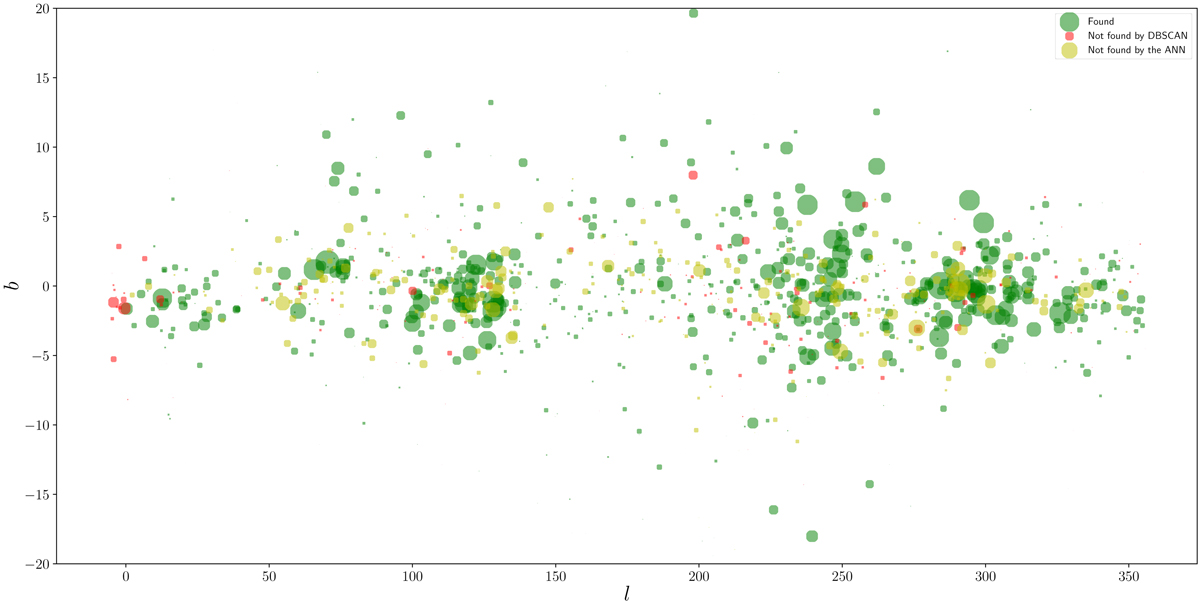
Distribution in Galactic coordinates (l vs. b) of the OCs catalogued in Cantat-Gaudin et al. (2018). Green dots represent OCs that our method recovers, red dots are OCs not found by DBSCAN, and yellow dots are OCs which are found by DBSCAN but for which the CMD is not recognised by our ANN. The size of the dots is proportional to the star density of the cluster (see text, Eq. (1)).
Current usage metrics show cumulative count of Article Views (full-text article views including HTML views, PDF and ePub downloads, according to the available data) and Abstracts Views on Vision4Press platform.
Data correspond to usage on the plateform after 2015. The current usage metrics is available 48-96 hours after online publication and is updated daily on week days.
Initial download of the metrics may take a while.