Fig. 5.
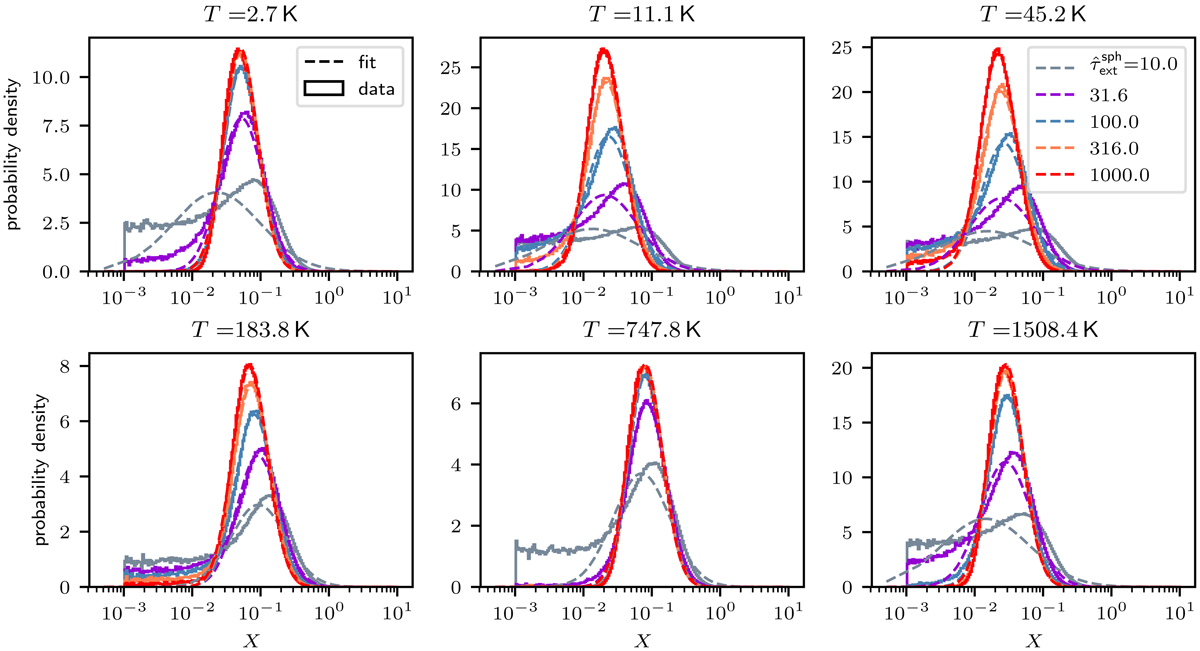
Results for the distributions of the variable X using 106 simulations per temperature and ![]() value. Outcomes for six different temperatures are displayed, which correspond to the resulting distributions (histograms) as well as their log-normal distribution fits (dashed lines) using corresponding colors. For details, see Sect. 2.2.
value. Outcomes for six different temperatures are displayed, which correspond to the resulting distributions (histograms) as well as their log-normal distribution fits (dashed lines) using corresponding colors. For details, see Sect. 2.2.
Current usage metrics show cumulative count of Article Views (full-text article views including HTML views, PDF and ePub downloads, according to the available data) and Abstracts Views on Vision4Press platform.
Data correspond to usage on the plateform after 2015. The current usage metrics is available 48-96 hours after online publication and is updated daily on week days.
Initial download of the metrics may take a while.