Fig. A.1.
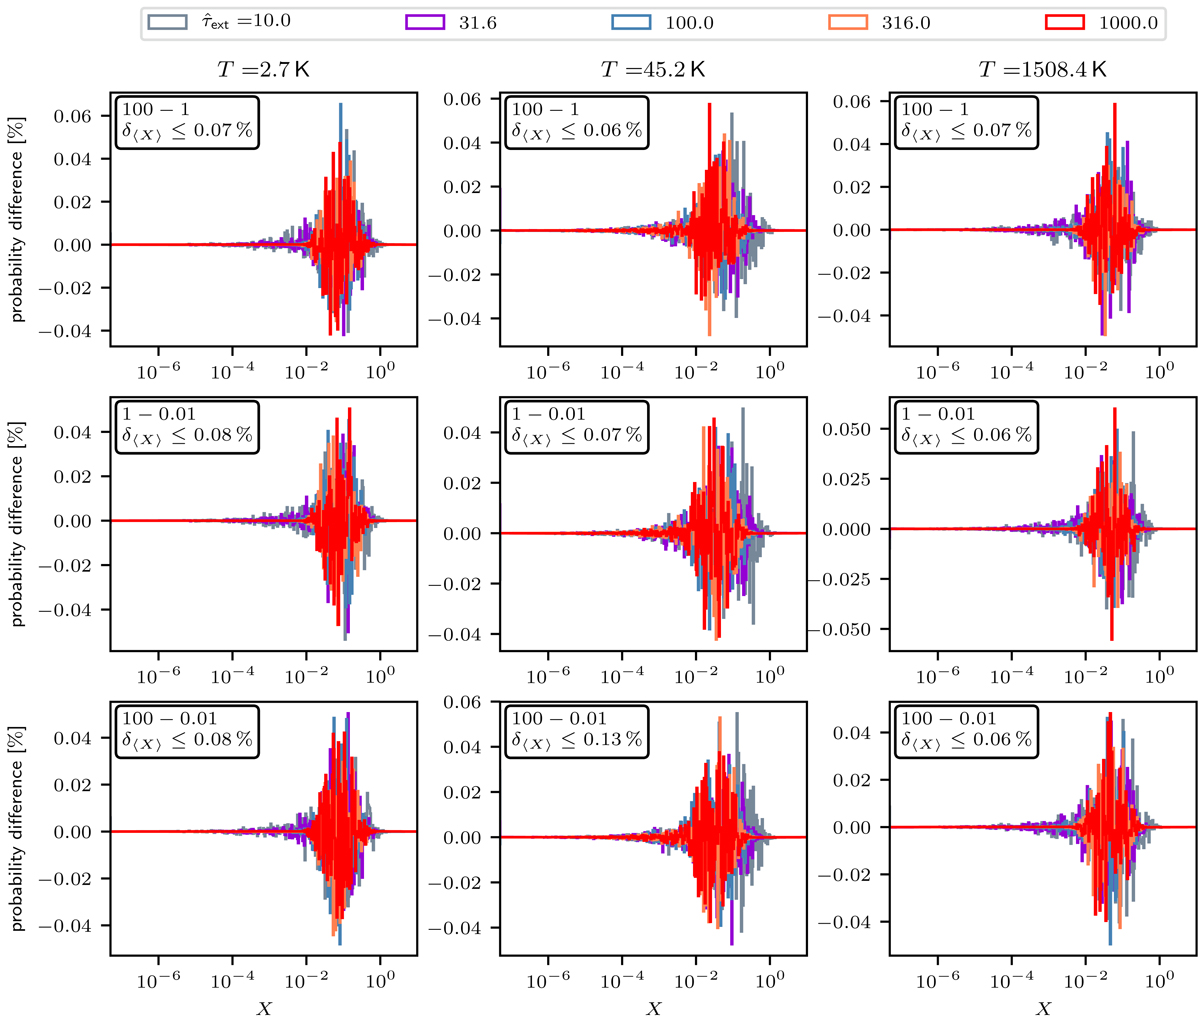
For three different temperatures 2.73 K, 45 K, and 1508 K in the first, second, and third columns, respectively, show the probability differences between distributions of X using simulations with different sphere sizes rsph but equal values of ![]() . For every temperature and sphere size, 106 simulations were performed. Text boxes contain information about the compared sphere sizes. For example, “100–1” denotes the comparison of the distribution using a sphere size of rsph = 100 au with the distribution using a sphere size of rsph = 1 au. In addition to that, the relative difference of the averages of two compared distributions is given by δ⟨X⟩ in the upper left corner of each plot. Low values of δ⟨X⟩ indicate a higher level of agreement.
. For every temperature and sphere size, 106 simulations were performed. Text boxes contain information about the compared sphere sizes. For example, “100–1” denotes the comparison of the distribution using a sphere size of rsph = 100 au with the distribution using a sphere size of rsph = 1 au. In addition to that, the relative difference of the averages of two compared distributions is given by δ⟨X⟩ in the upper left corner of each plot. Low values of δ⟨X⟩ indicate a higher level of agreement.
Current usage metrics show cumulative count of Article Views (full-text article views including HTML views, PDF and ePub downloads, according to the available data) and Abstracts Views on Vision4Press platform.
Data correspond to usage on the plateform after 2015. The current usage metrics is available 48-96 hours after online publication and is updated daily on week days.
Initial download of the metrics may take a while.