Fig. 6
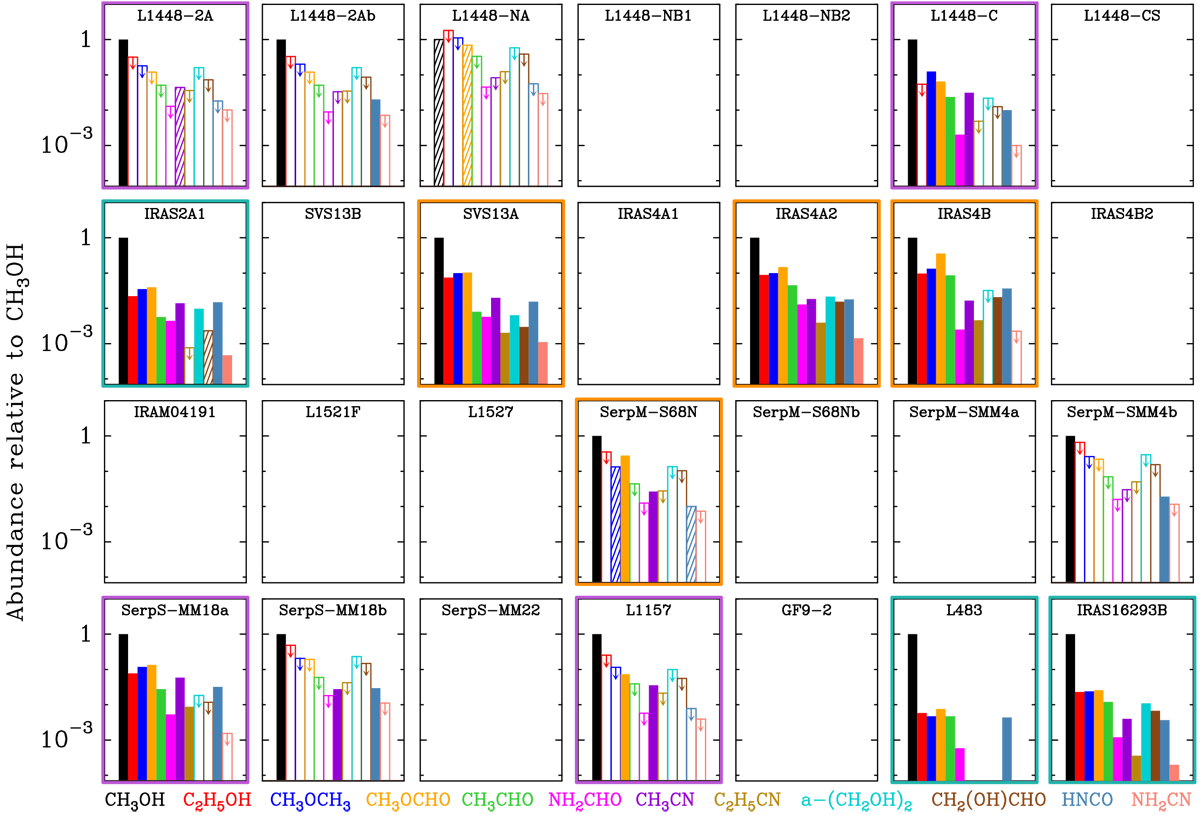
Same as Fig. 5 but for the molecular abundance relative to methanol. Sources where methanol is not detectedhave an empty panel. The colored boxes highlight three groups of sources defined on the basis of similarities in their chemical composition: group 1 in blue, group 2 in orange, and group 3 in magenta.
Current usage metrics show cumulative count of Article Views (full-text article views including HTML views, PDF and ePub downloads, according to the available data) and Abstracts Views on Vision4Press platform.
Data correspond to usage on the plateform after 2015. The current usage metrics is available 48-96 hours after online publication and is updated daily on week days.
Initial download of the metrics may take a while.