Fig. 5
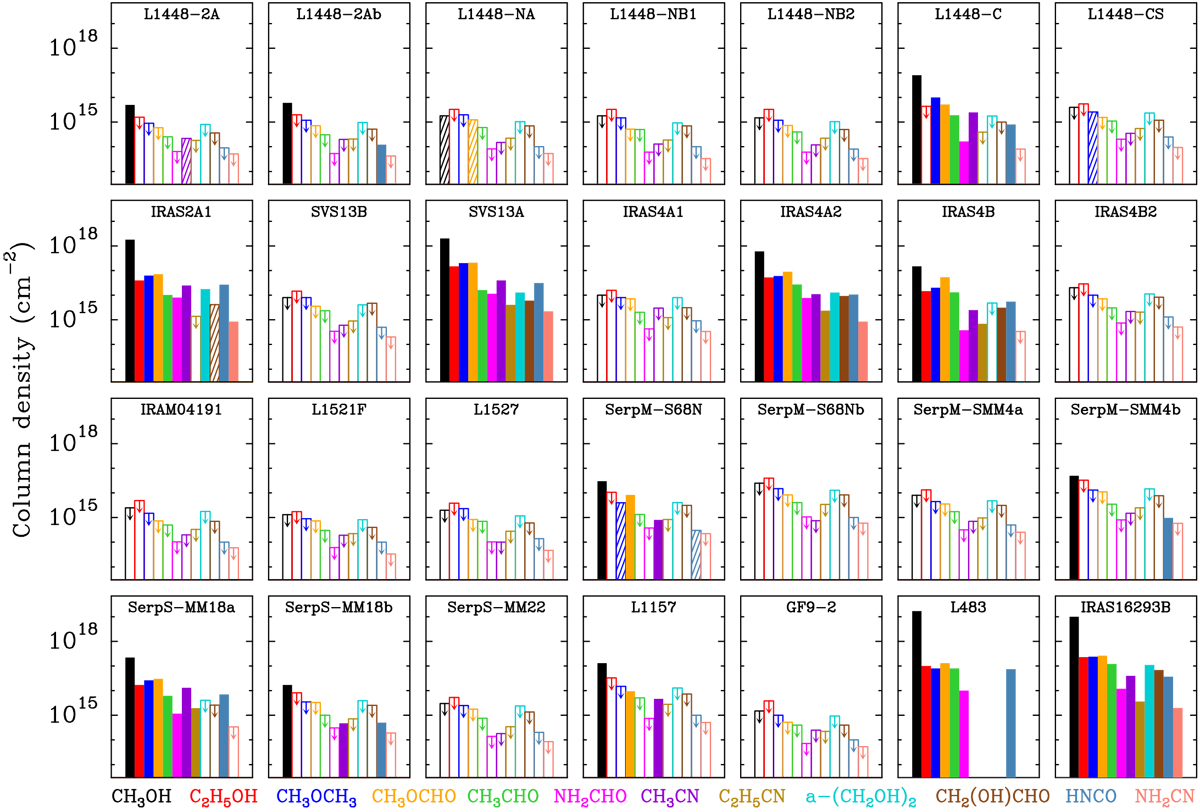
Column densities of (complex) organic molecules toward CALYPSO sources. The color coding of the molecules is indicated at the bottom. Secure detections are shown as plain bars, tentative detections as hatched bars, and upper limits as empty bars with a downward arrow. The name of each source is indicated in each panel. Two rightmost panels in the bottom row: column densities of two other Class 0 protostars collected from the literature (see Sect. 3.7 for references).
Current usage metrics show cumulative count of Article Views (full-text article views including HTML views, PDF and ePub downloads, according to the available data) and Abstracts Views on Vision4Press platform.
Data correspond to usage on the plateform after 2015. The current usage metrics is available 48-96 hours after online publication and is updated daily on week days.
Initial download of the metrics may take a while.