Fig. 2
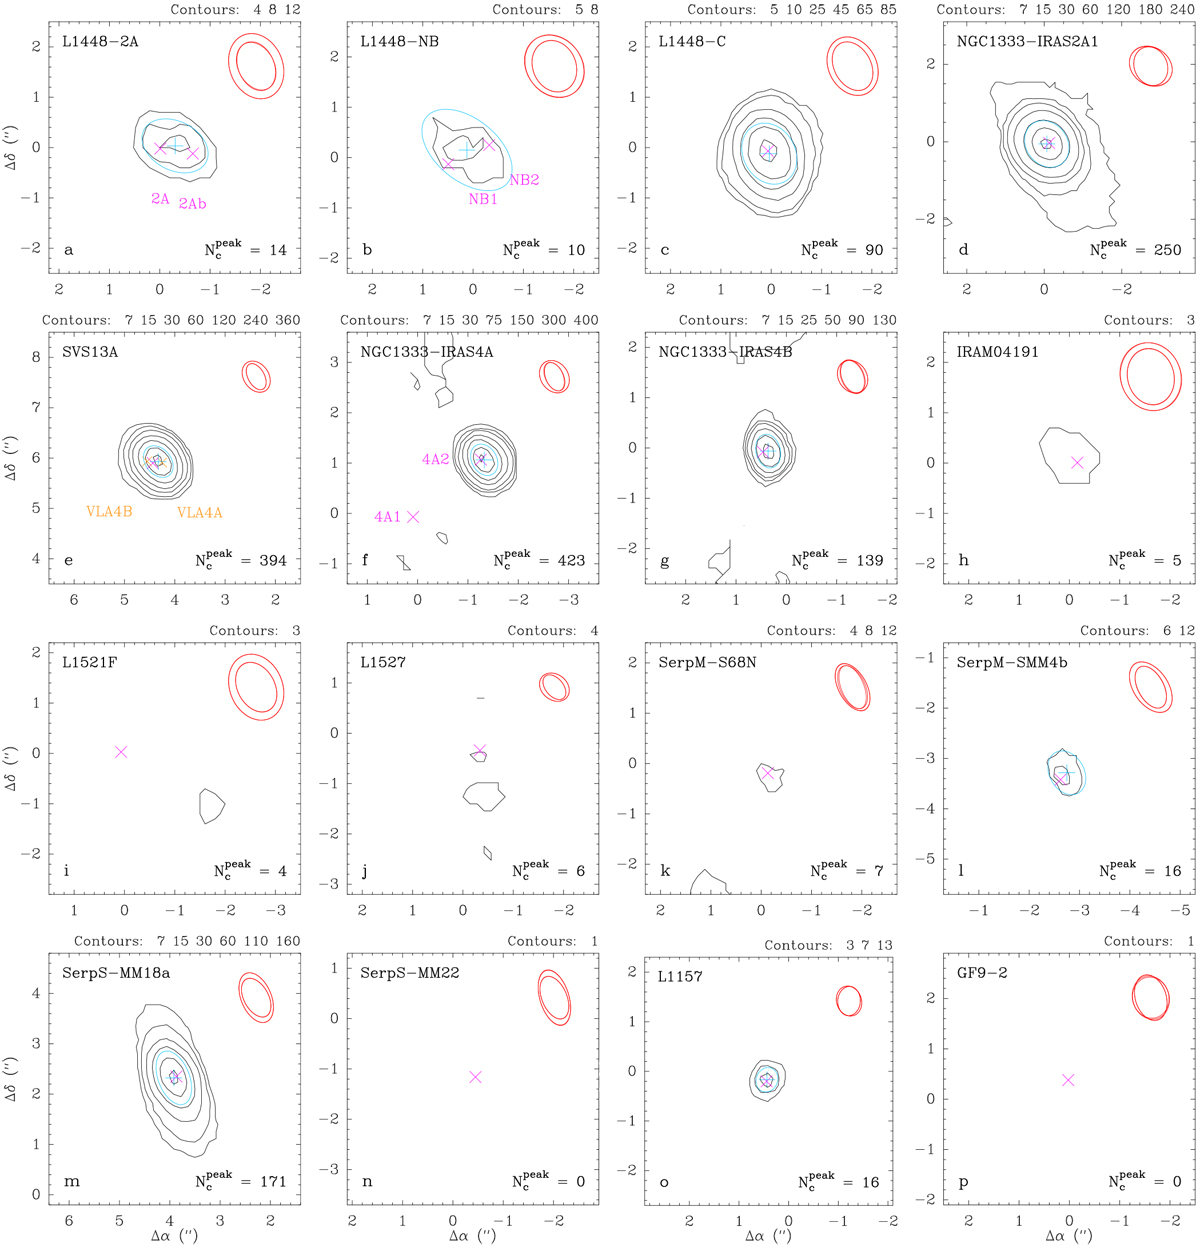
Maps of number of channels with signal detected above six times the rms noise level in the continuum-removed WideX spectra at 1.3 and 1.4 mm, excluding CO 2–1, 13 CO 2–1, C18 O 2–1, SiO 5–4, SO 56–45, OCS 18–17, and OCS 19–18. In each panel, the red ellipses show the synthesized beam sizes at 219 and 231 GHz. The pink crossesindicate the positions of the continuum emission peaks derived by Maury et al. (2019), and the orange crosses in panel e mark the positions of the binary components VLA4A and VLA4B of SVS13A determined by Lefèvre et al. (2017). The peak count is given in the bottom right corner. For sources with a peak count higher than 9, the blue cross and ellipse show the position of the peak and the width (FWHM) of a Gaussian fit to the map, respectively. The contourlevels are indicated above each panel. The coordinates at the origin are listed in Table C.1. Maps over alarger field of view can be found in Fig. C.1.
Current usage metrics show cumulative count of Article Views (full-text article views including HTML views, PDF and ePub downloads, according to the available data) and Abstracts Views on Vision4Press platform.
Data correspond to usage on the plateform after 2015. The current usage metrics is available 48-96 hours after online publication and is updated daily on week days.
Initial download of the metrics may take a while.