Fig. 13
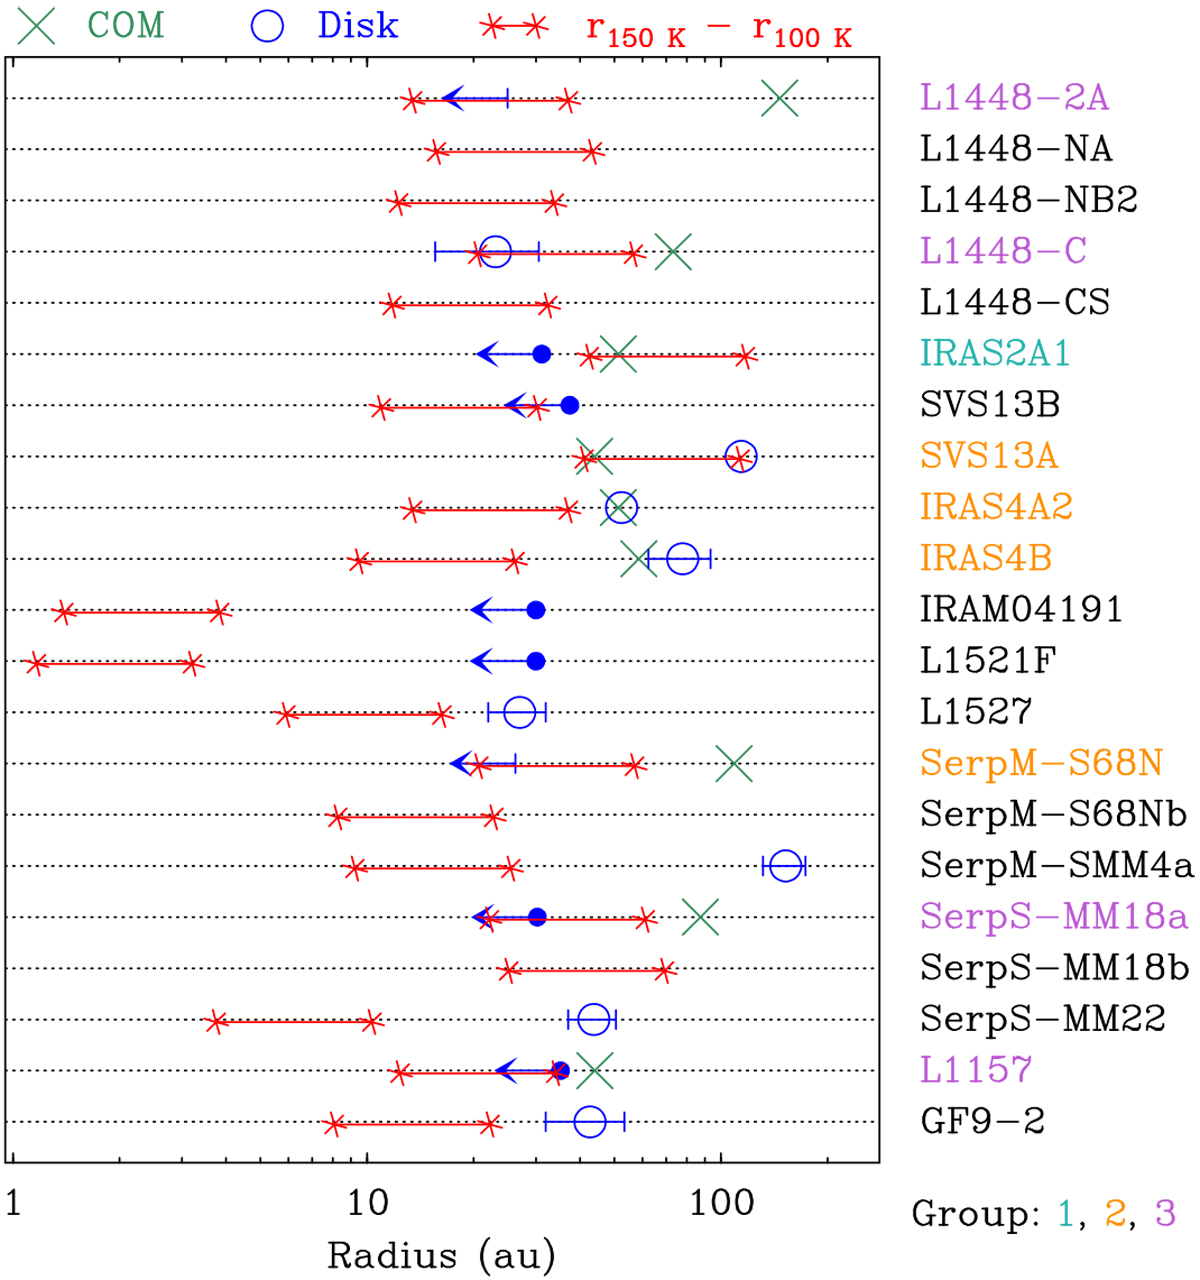
Comparison of the COM emission radius (green cross) to the disk radius (blue circle, with error bar when available) and the range of radii over which ices are expected to sublimate from the grain mantles (red bar terminated by stars). The COM emission radius corresponds to half the FWHM size reported in Table 4, when COMs are detected. The disk radius corresponds to half the FWHM size derived by Maury et al. (2019) when they detect a candidate disk-like structure, corrected for the new distance when needed. The radii of the candidate disk-like structures for SVS13A(circumbinary in this case) and IRAS4A2 come from a similar analysis (A. Maury, priv. comm.). A blue dot with an arrow pointing to the left indicates the upper limit on the radius of a detected but unresolved disk. A blue bar with an arrow pointing to the left represents a disk nondetection with an upper limit on the radius that could still be estimated by Maury et al. (2019). All disk parameters were rescaled to the new distances when necessary. For each source, the two red stars mark the temperature range 100–150 K (from right to left) expected from the luminosity given in Table 1. The names of the sources belonging to groups 1, 2, and 3 are color-coded with the color scheme indicated in the bottom right corner, as in the case of the frames in Fig. 6 and as described in Sect. 3.7.
Current usage metrics show cumulative count of Article Views (full-text article views including HTML views, PDF and ePub downloads, according to the available data) and Abstracts Views on Vision4Press platform.
Data correspond to usage on the plateform after 2015. The current usage metrics is available 48-96 hours after online publication and is updated daily on week days.
Initial download of the metrics may take a while.