Fig. H.1
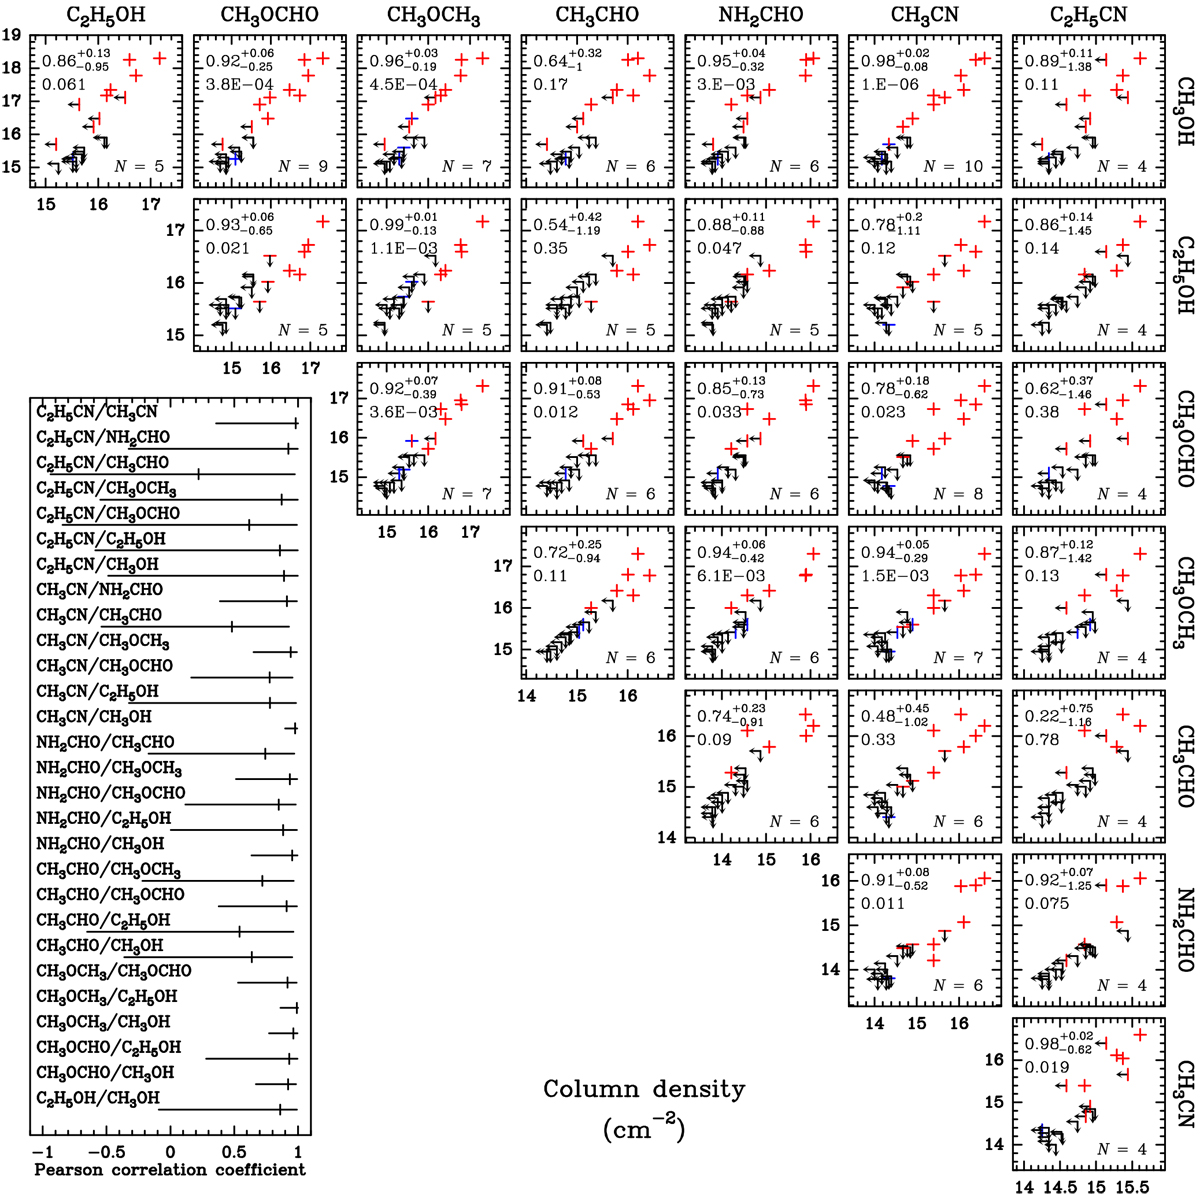
Correlation plots of the column densities of various pairs of COMs. The labels of the axes indicate the decimal logarithm of the column densities. Firm and tentative detections are indicated with red and blue crosses (or bars) respectively. Upper limits are indicated with black arrows. In each panel, the Pearson correlation coefficient and its 95% confidence interval are displayed in the top left corner, followed by the P-value just below. The number of measurements used to compute the correlation coefficient is given in the bottom right corner of each panel. The plot in the lower left corner of the figure displays the Pearson correlation coefficients of all pairs of COMs with their 95% confidence intervals.
Current usage metrics show cumulative count of Article Views (full-text article views including HTML views, PDF and ePub downloads, according to the available data) and Abstracts Views on Vision4Press platform.
Data correspond to usage on the plateform after 2015. The current usage metrics is available 48-96 hours after online publication and is updated daily on week days.
Initial download of the metrics may take a while.