Fig. 11
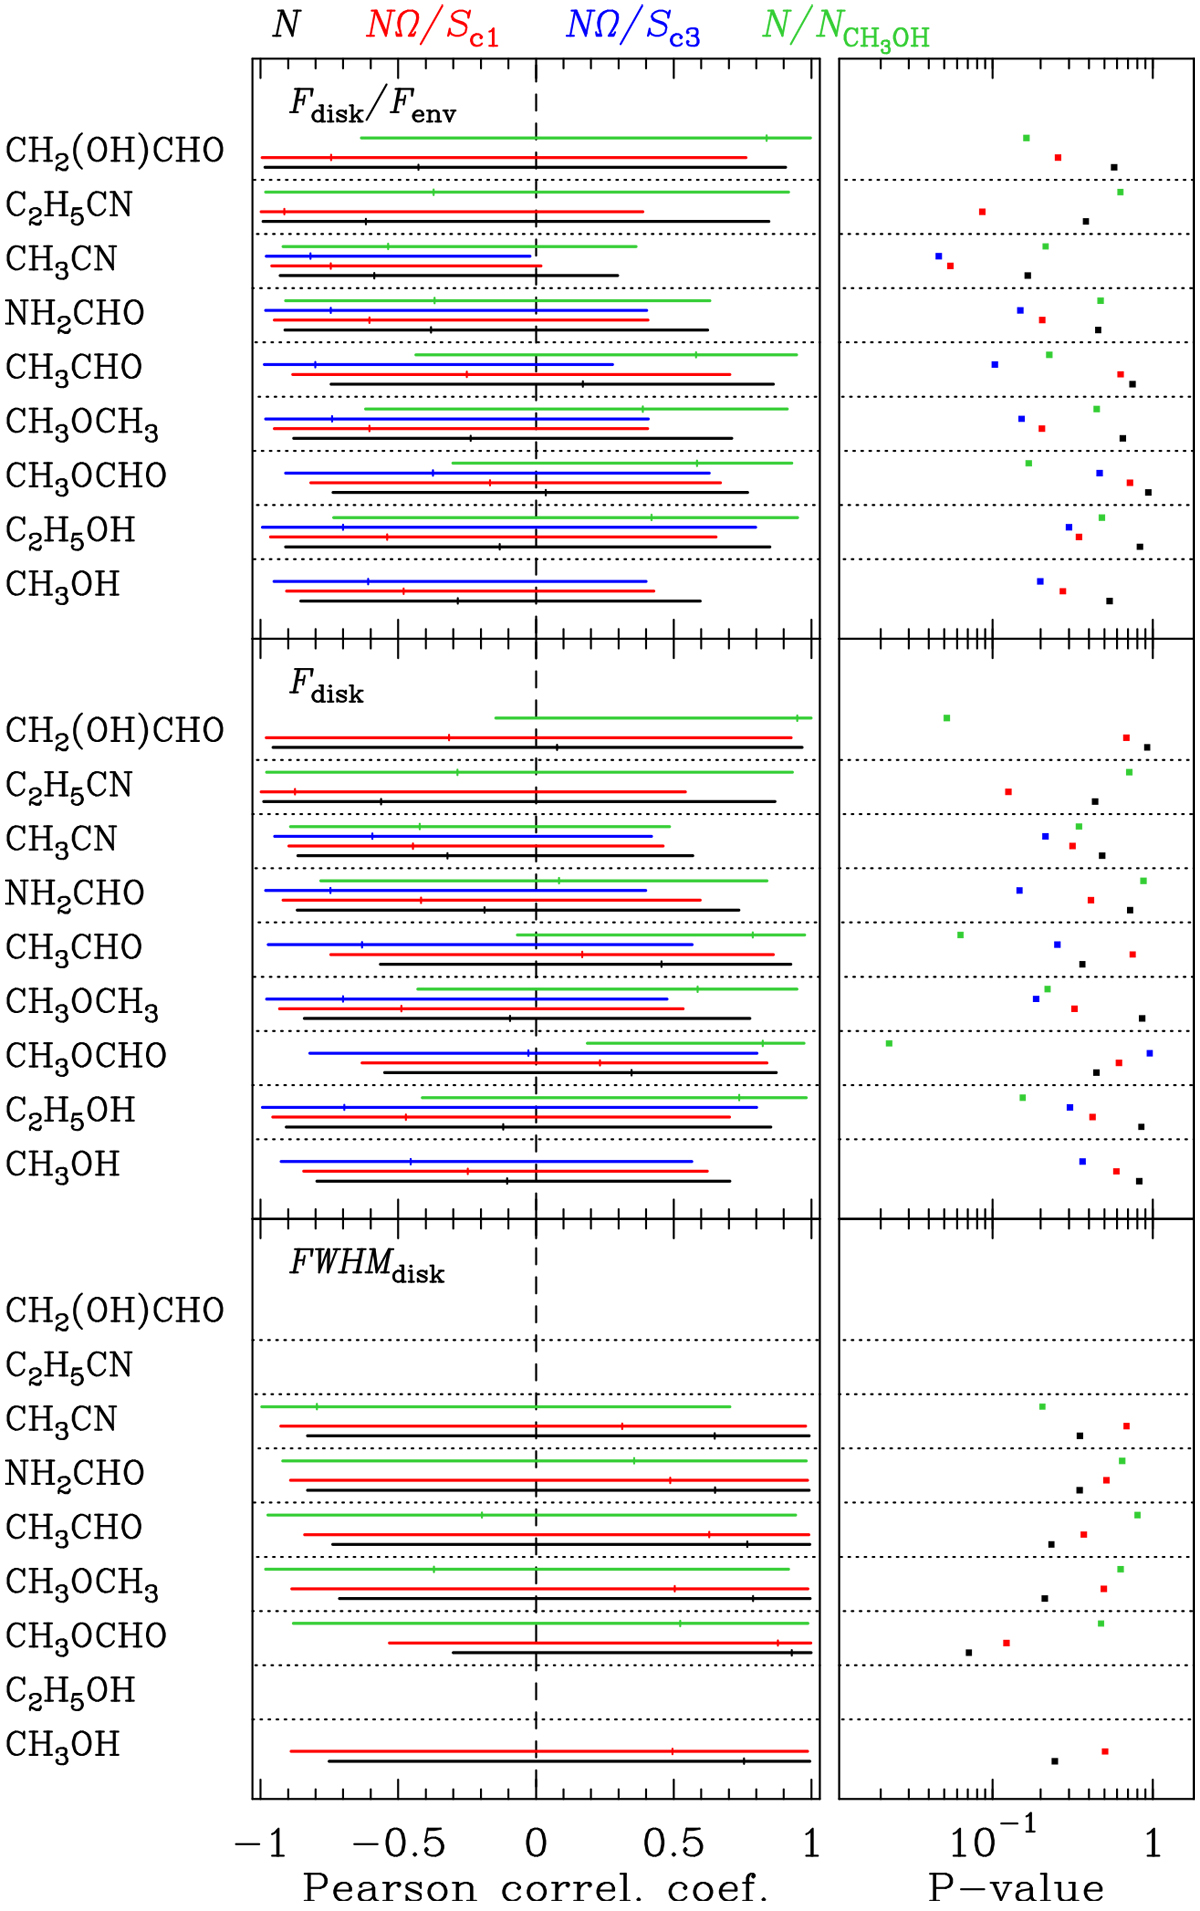
Pearson correlation coefficients with 95% confidence interval (left) and P-value (right) between nine COMs and several disk properties for the CALYPSO source sample. These parameters were derived from the plots shown in Figs. J.1–J.3 and 10. The colors indicate the variables used to evaluate the degree of correlation between the molecules and the disk properties, with the same meaning as in Fig. 9. The disk properties investigated here are the disk radius (bottom), the disk flux density (middle), and the flux density ratio of the disk to the envelope (top).
Current usage metrics show cumulative count of Article Views (full-text article views including HTML views, PDF and ePub downloads, according to the available data) and Abstracts Views on Vision4Press platform.
Data correspond to usage on the plateform after 2015. The current usage metrics is available 48-96 hours after online publication and is updated daily on week days.
Initial download of the metrics may take a while.