Fig. 2
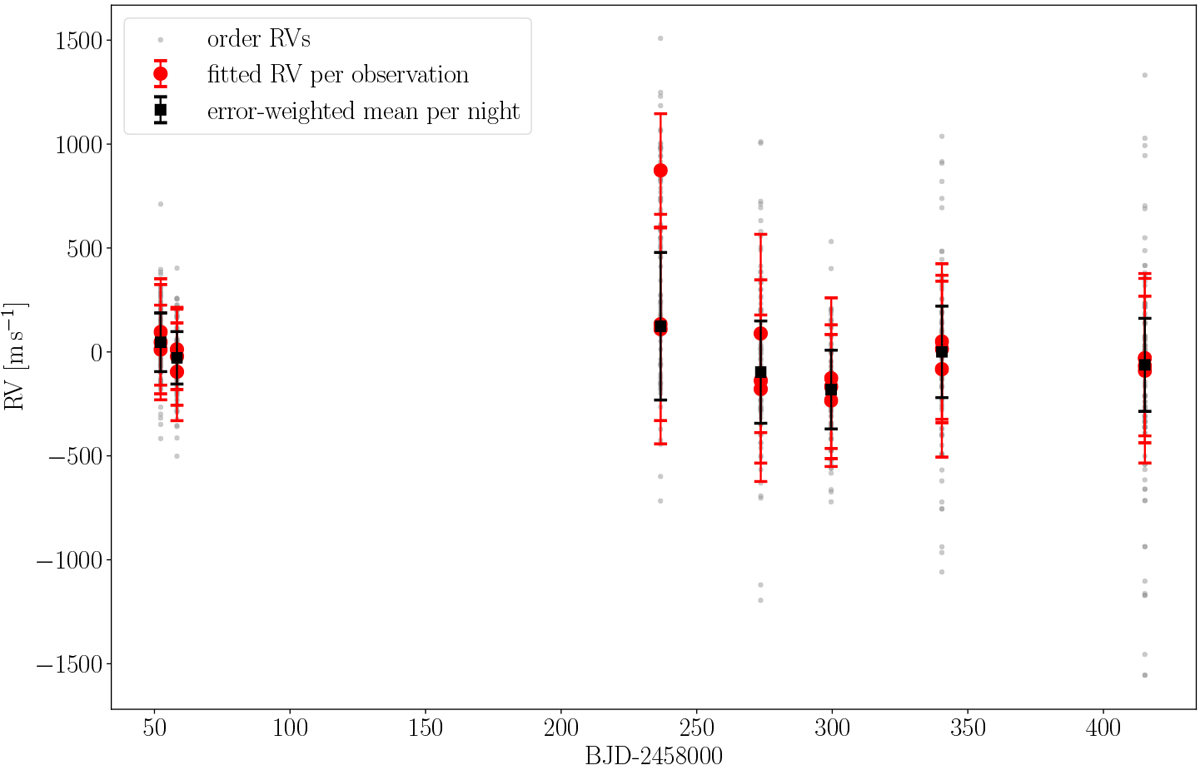
Radial velocity measurements of Kepler-1625. Grey dots represent the measurements derived with the SERVAL pipeline for spectral orders 20–48 of the visible channel of CARMENES. Three red circles for each observation night show the peak values of the respective normal distribution after fitting to the co-added normal distributions of all orders. Black squares with error bars symbolise the nightly error-weighted mean RV values and mean errors.
Current usage metrics show cumulative count of Article Views (full-text article views including HTML views, PDF and ePub downloads, according to the available data) and Abstracts Views on Vision4Press platform.
Data correspond to usage on the plateform after 2015. The current usage metrics is available 48-96 hours after online publication and is updated daily on week days.
Initial download of the metrics may take a while.