Fig. B.1.
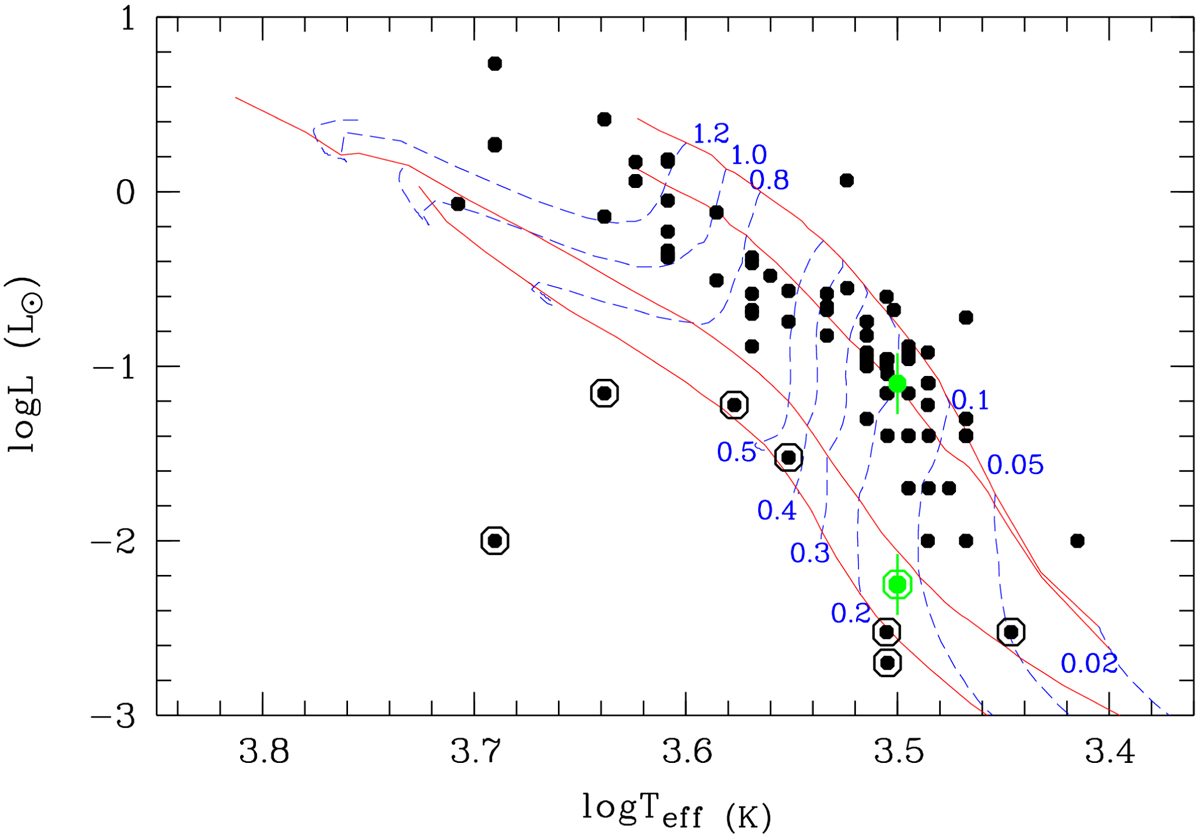
HR diagramme of the Lupus sample (black dots) with 2MASS J15491331 overplotted in green. The PMS evolutionary tracks of Baraffe et al. (2015) are overplotted with the dashed blue lines, while isochrones (1 Myr, 3 Myr, 30 Myr and 10 Gyr) are the red lines. Subluminous objects are overplotted with encircled dots (2MASS J15491331 in green). The green non-encircled dot is 2MASS J15491331 when luminosity is corrected by disc obscuration.
Current usage metrics show cumulative count of Article Views (full-text article views including HTML views, PDF and ePub downloads, according to the available data) and Abstracts Views on Vision4Press platform.
Data correspond to usage on the plateform after 2015. The current usage metrics is available 48-96 hours after online publication and is updated daily on week days.
Initial download of the metrics may take a while.