Fig. 3.
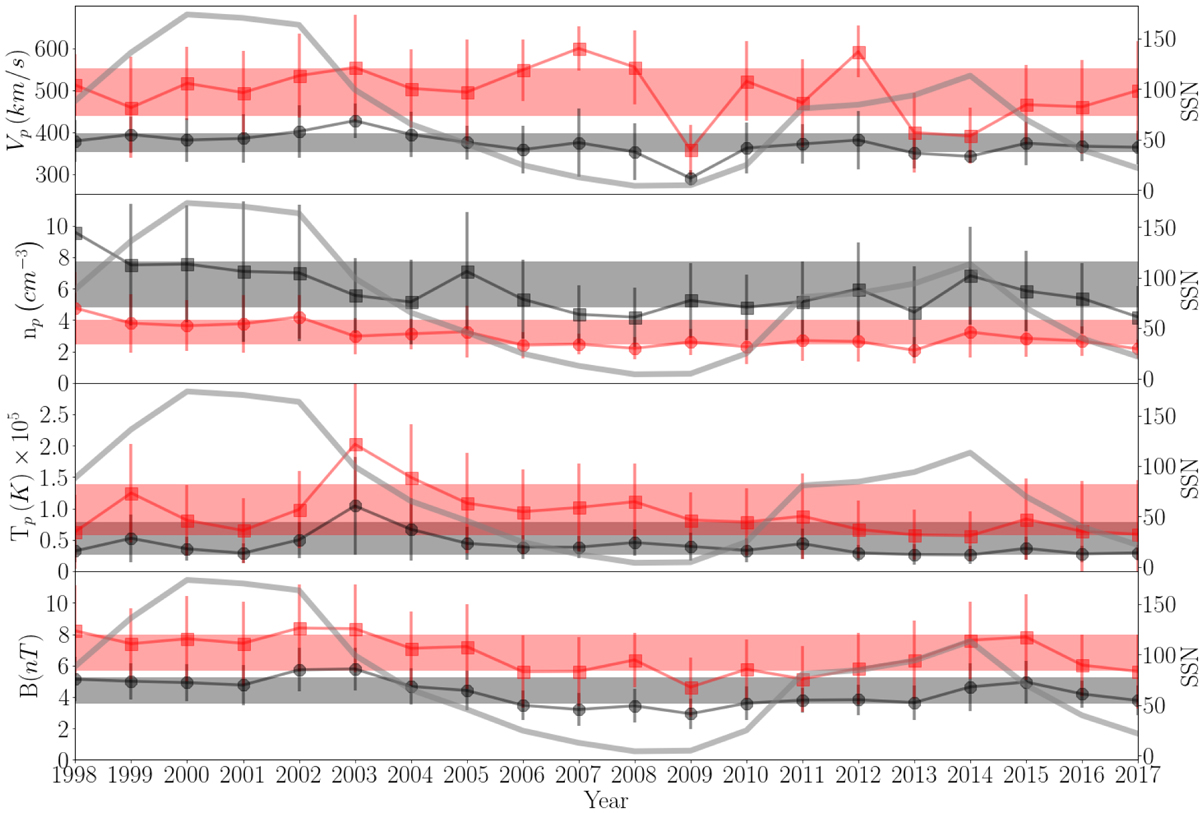
From top to bottom: yearly position of the centre of the peak of every single Gaussian curve, p, for Vp, np, Tp and B PDFs. Black (red) points correspond to slow (fast) wind. Uncertainty has been estimated using the Gaussian rms width of the corresponding single curve, w. The grey line in the four plots represents the sunspot number, with the corresponding y-axis on the right of every plot.
Current usage metrics show cumulative count of Article Views (full-text article views including HTML views, PDF and ePub downloads, according to the available data) and Abstracts Views on Vision4Press platform.
Data correspond to usage on the plateform after 2015. The current usage metrics is available 48-96 hours after online publication and is updated daily on week days.
Initial download of the metrics may take a while.