Fig. B.1
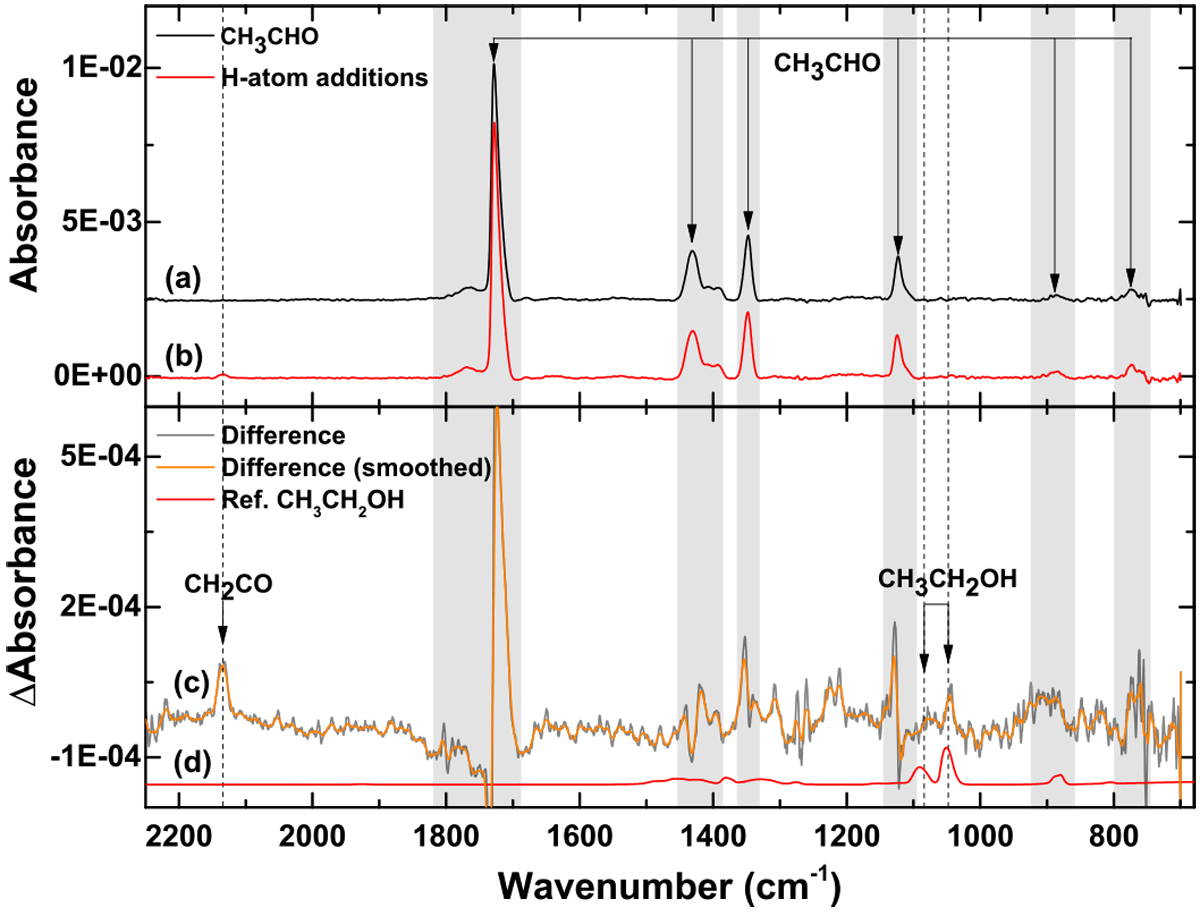
IR spectra of pure CH3CHO ice (a), subsequent hydrogenation of predeposited ice with a H-atom flux of 1.2 × 10¹³ atoms cm−2 s−1 for 30 min at 10 K (b), RAIR difference spectrum obtained after hydrogenation of CH3CHO ice (c), and reference spectrum of CH3CHO ice (d). The dashed lines and arrows are shown for the vibrational peaks of the studied molecules. IR spectra are offset for clarity.
Current usage metrics show cumulative count of Article Views (full-text article views including HTML views, PDF and ePub downloads, according to the available data) and Abstracts Views on Vision4Press platform.
Data correspond to usage on the plateform after 2015. The current usage metrics is available 48-96 hours after online publication and is updated daily on week days.
Initial download of the metrics may take a while.