Fig. B.3
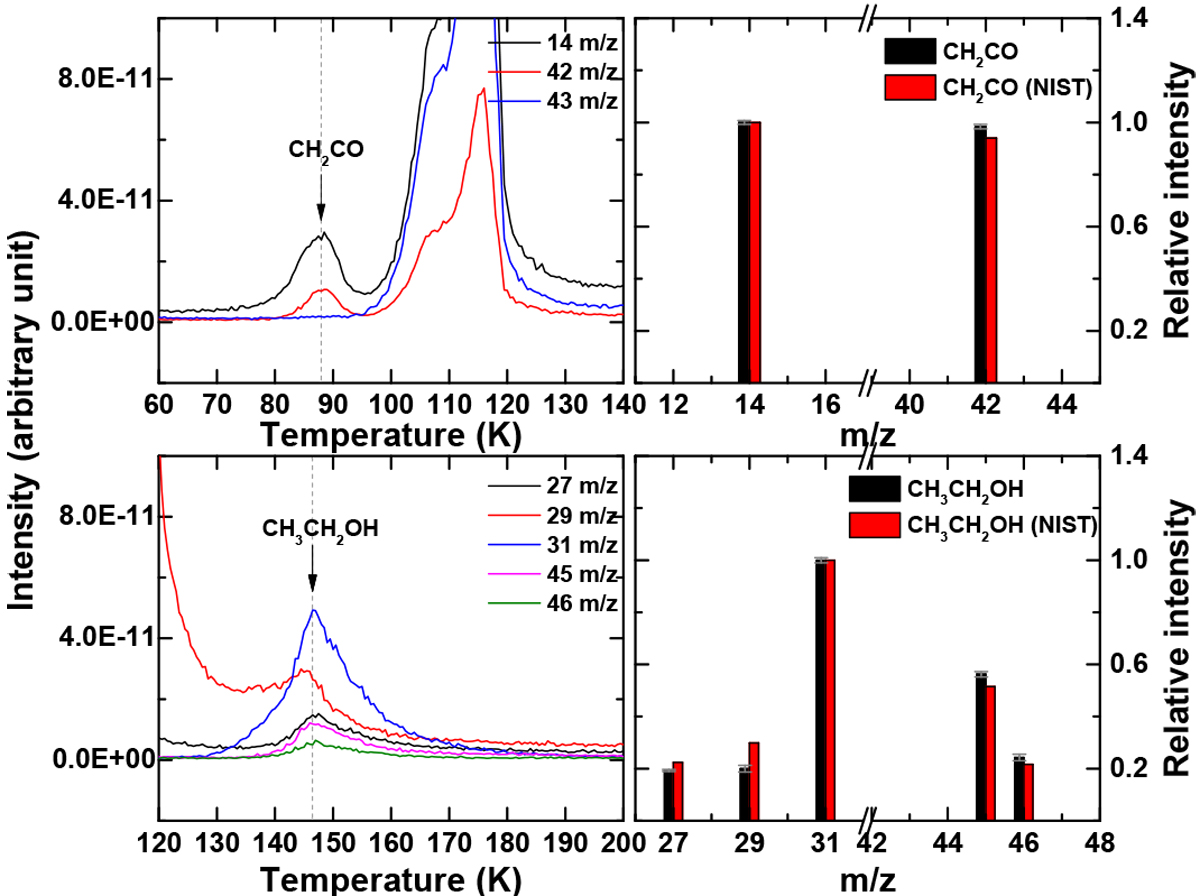
Left: TPD mass spectra obtained after 360 min of codeposition of CH3CHO + H (exp. c2) at 10 K. The applied deposition ratio of CH3CHO:H was 2:40, and the used H-atom flux was 1.2 × 10¹³ atoms cm−2 s−1. Only relevant m/z channels are shown. The arrows and dashed lines indicate the peak position of the corresponding COMs. Right: comparison of the ionization fragmentation pattern of the detected product (black) with the standard pattern in the NIST database (red).
Current usage metrics show cumulative count of Article Views (full-text article views including HTML views, PDF and ePub downloads, according to the available data) and Abstracts Views on Vision4Press platform.
Data correspond to usage on the plateform after 2015. The current usage metrics is available 48-96 hours after online publication and is updated daily on week days.
Initial download of the metrics may take a while.