Fig. 5
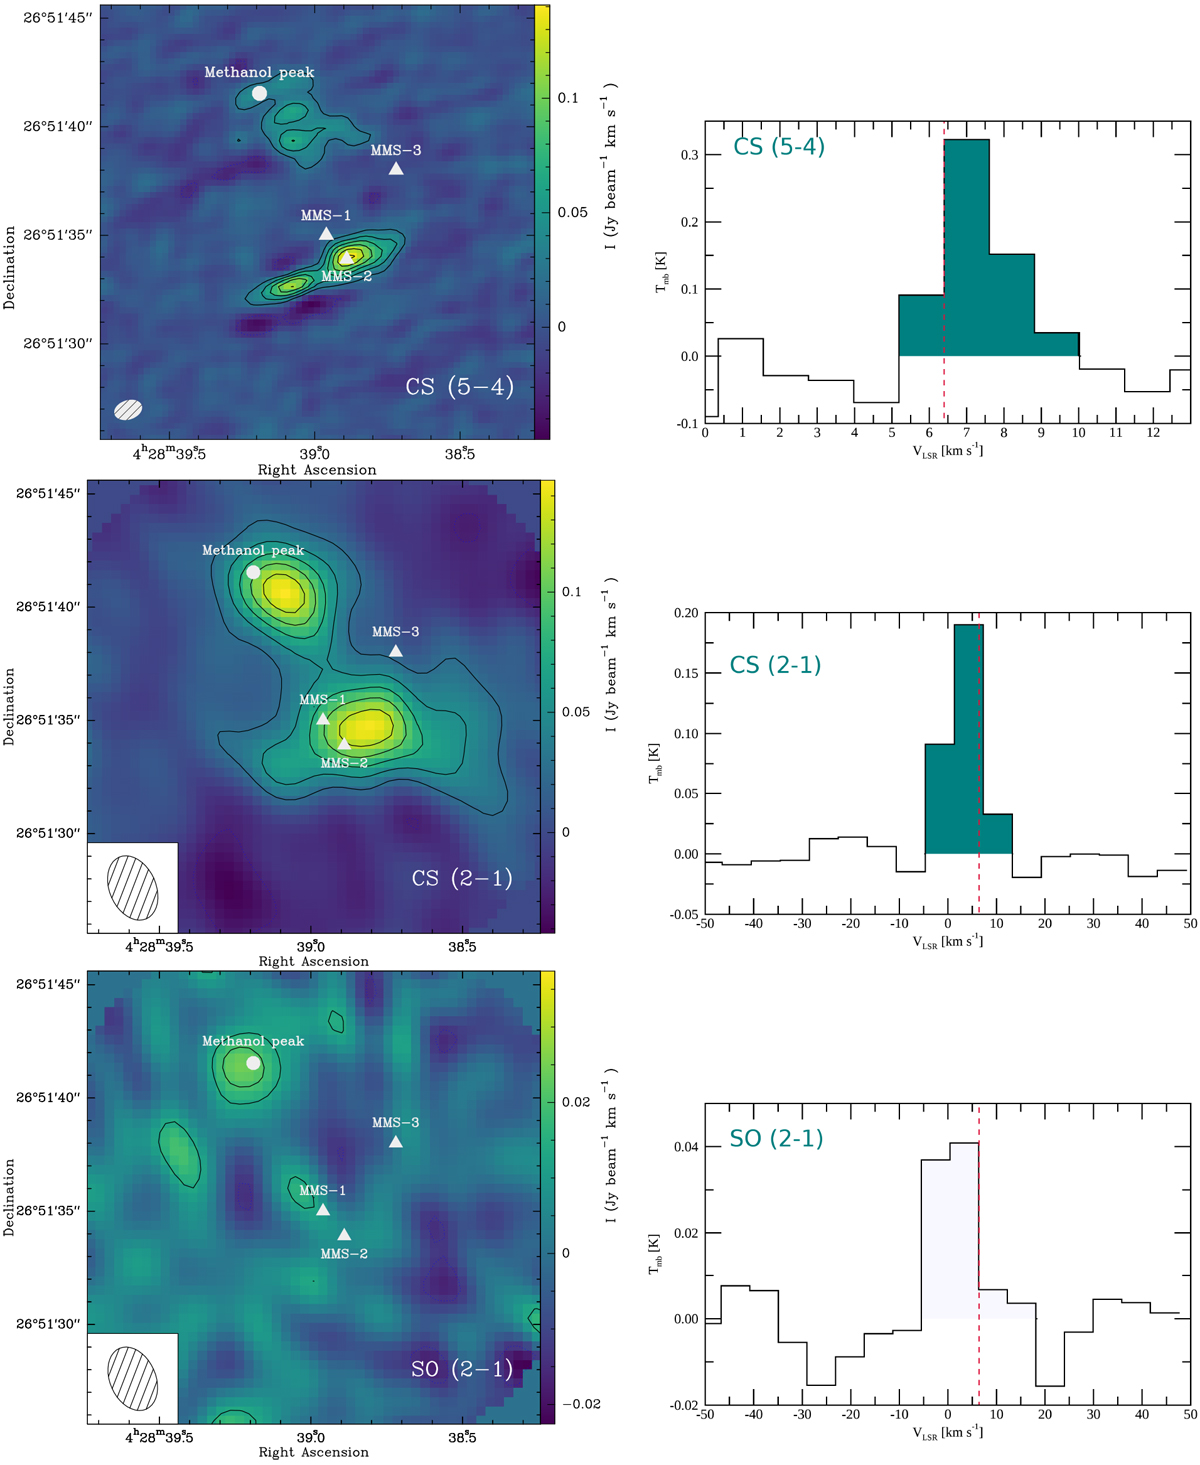
Top left panel: CS (5–4) integrated-intensity emission map as seen with ALMA (project number 2012.1.00239.S, see Sect. 3.4). The contour levels are at 3σ (where 1σ = 7.5 mJy beam−1 km s−1). Middle left panel: CS (2–1) integrated-intensity emission map as seen with NOEMA over the line profile (corrected for primary beam attenuation). The contour levels are at 3σ (where 1σ = 8.3 mJy beam−1 km s−1). Bottom left panel: SO (2-1) integrated-intensity emission map as seen with NOEMA over the line profile. The first contour is at 2σ and the levelstep at 1σ (where 1σ = 6.6 mJy beam−1 km s−1). For each map, the synthesized beam is shown in the bottom left corner. Positions of sources MMS-1, MMS-2, and MMS-3 along with that of the methanol peak (or blob) are indicated. Right panels, from top to bottom: spectra of the CS (5–4), CS (2–1), and SO (2–1) spectra taken in direction of the methanol blob. Dashed red lines indicate a VLSR = 6.4 km s−1.
Current usage metrics show cumulative count of Article Views (full-text article views including HTML views, PDF and ePub downloads, according to the available data) and Abstracts Views on Vision4Press platform.
Data correspond to usage on the plateform after 2015. The current usage metrics is available 48-96 hours after online publication and is updated daily on week days.
Initial download of the metrics may take a while.