Fig. 4
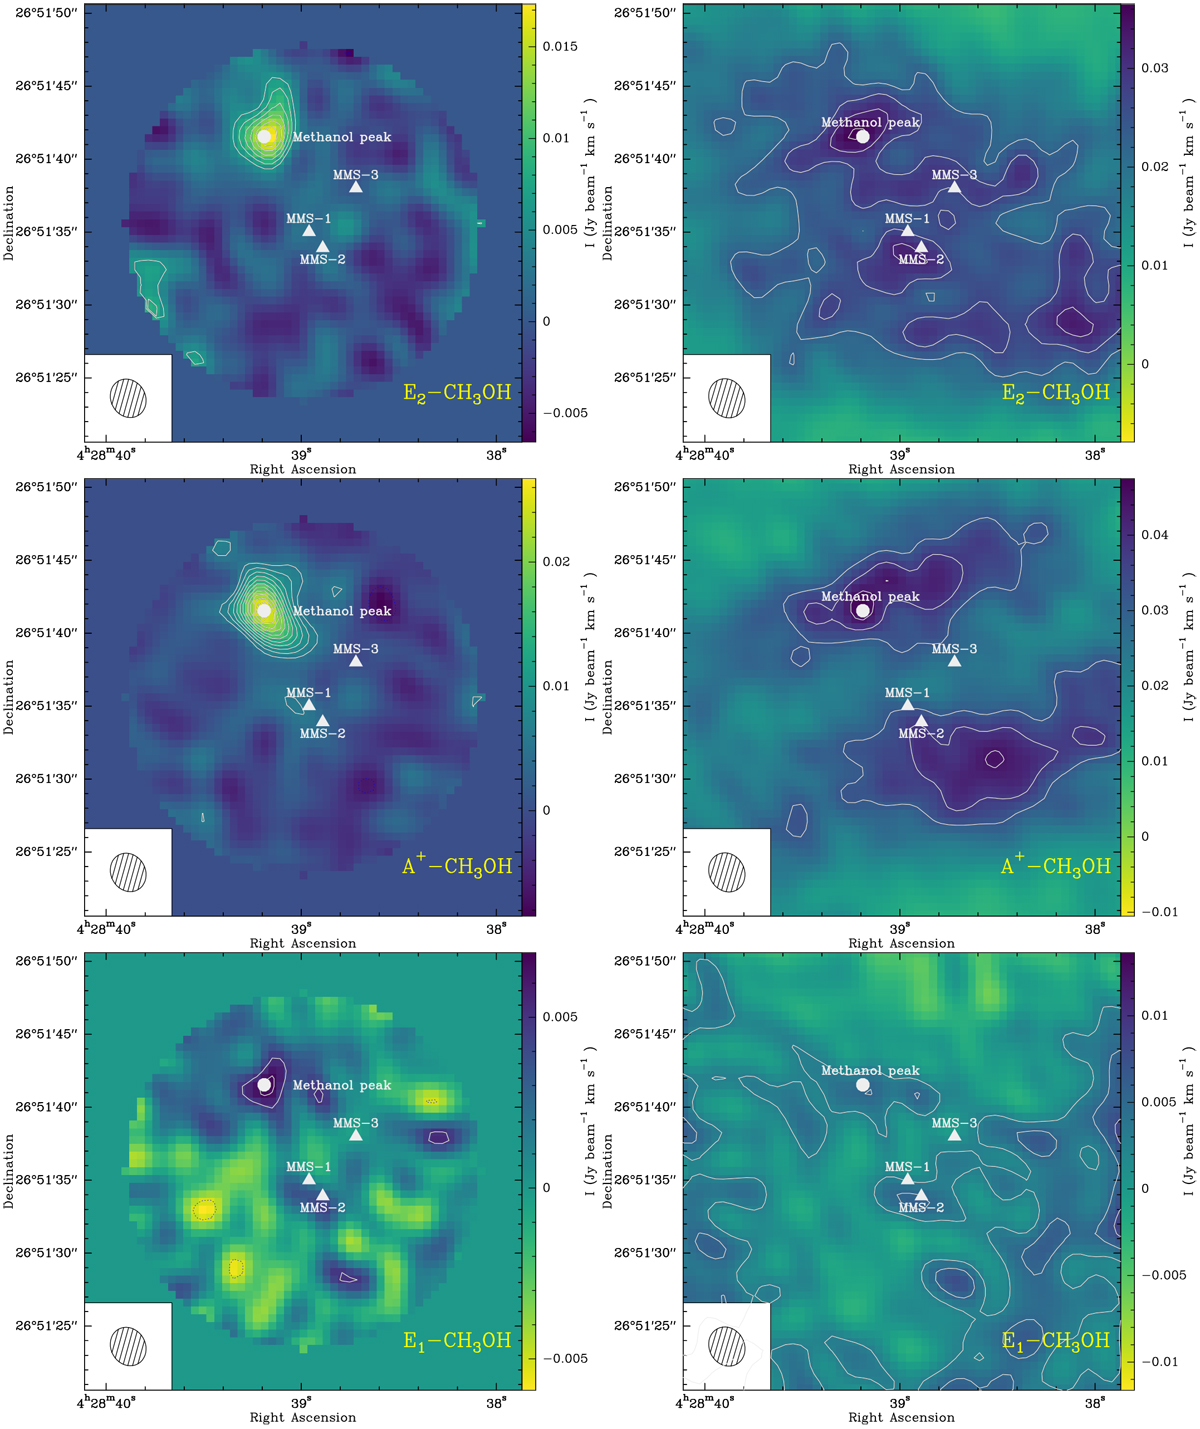
Methanol integrated-emission maps (corrected from the primary beam attenuation). Top left: E2 -CH3OH integrated intensity emission map over the line profile. The first contour is at 3σ and the levelstep at 1σ (where 1σ = 1.9 mJy beam−1 km s−1). Top right: CH3OH-E moment-zero maps from the combined IRAM-30 m and NOEMA data. The first contour is at 5σ and the levelstep at 1σ (where 1σ = 4.5 mJy beam−1 km s−1). Middle left: A+–CH3OH integrated-intensity emission map over the line profile. The first contour is at 3σ and the levelstep at 1σ (where 1σ = 1.9 mJy beam−1 km s−1). Middle right: A+–CH3OH moment-zero maps from the combined IRAM-30 m and NOEMA data. The first contour is at 5σ and the levelstep at 1σ (where 1σ = 6.3 mJy beam−1 km s−1). Bottom left: E1–CH3OH integrated-intensity emission map over the line profile. The first contour is at 3σ and the levelstep at 1σ (where 1σ = 1.6 mJy beam−1 km s−1). Bottom right: E1–CH3OH moment-zero maps from the combined IRAM-30 m and NOEMA data. The first contour is at 1σ (2.6 mJy beam−1 km s−1).
Current usage metrics show cumulative count of Article Views (full-text article views including HTML views, PDF and ePub downloads, according to the available data) and Abstracts Views on Vision4Press platform.
Data correspond to usage on the plateform after 2015. The current usage metrics is available 48-96 hours after online publication and is updated daily on week days.
Initial download of the metrics may take a while.