Free Access
Fig. 8
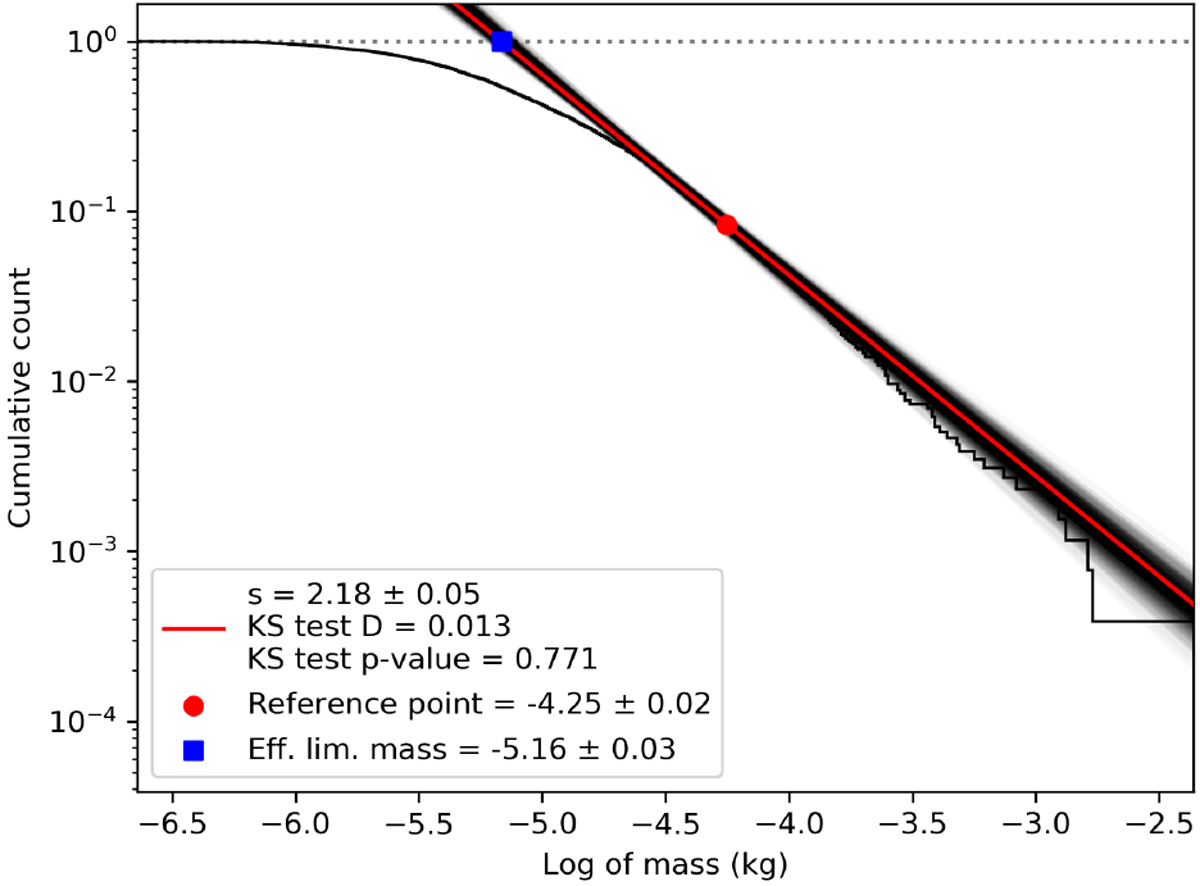
Cumulative distribution of masses of sporadic meteors from the CAMO influx camera. The red line indicates the slope of the fitted mass index, while the shaded black lines represent the Monte Carlo fits of the resampled set as described in the text.
Current usage metrics show cumulative count of Article Views (full-text article views including HTML views, PDF and ePub downloads, according to the available data) and Abstracts Views on Vision4Press platform.
Data correspond to usage on the plateform after 2015. The current usage metrics is available 48-96 hours after online publication and is updated daily on week days.
Initial download of the metrics may take a while.