Fig. 5
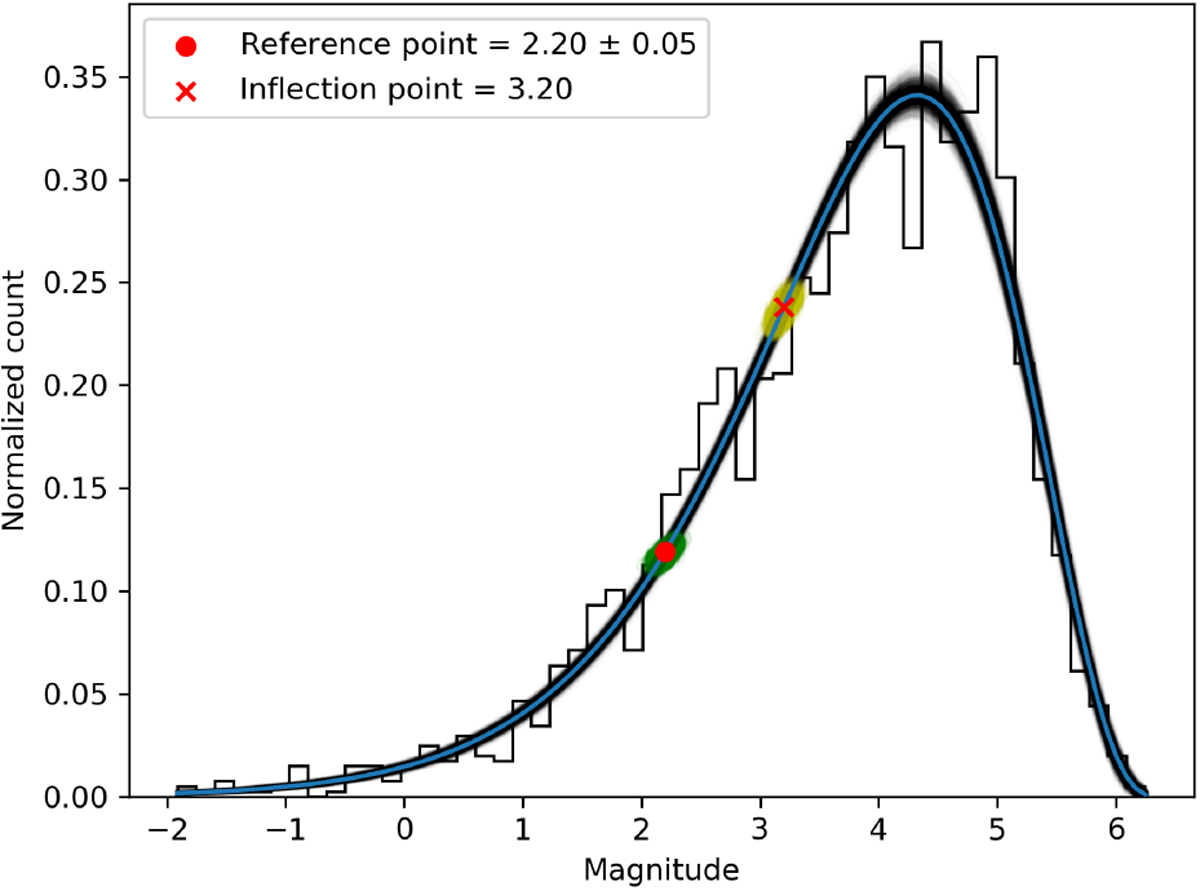
Distribution of peak R-magnitudes of sporadic meteors from the CAMO influx camera (histogram) and the gamma distribution fit (blue line is the main fit, black lines are all Monte Carlo runs). The jaggedness of the histogram is due to the limited precision of the magnitudes in the data file. The yellow shaded area around the inflection point represents the uncertainty in the inflection point location, and the green shaded area the uncertainty around the reference point.
Current usage metrics show cumulative count of Article Views (full-text article views including HTML views, PDF and ePub downloads, according to the available data) and Abstracts Views on Vision4Press platform.
Data correspond to usage on the plateform after 2015. The current usage metrics is available 48-96 hours after online publication and is updated daily on week days.
Initial download of the metrics may take a while.