Fig. 1.
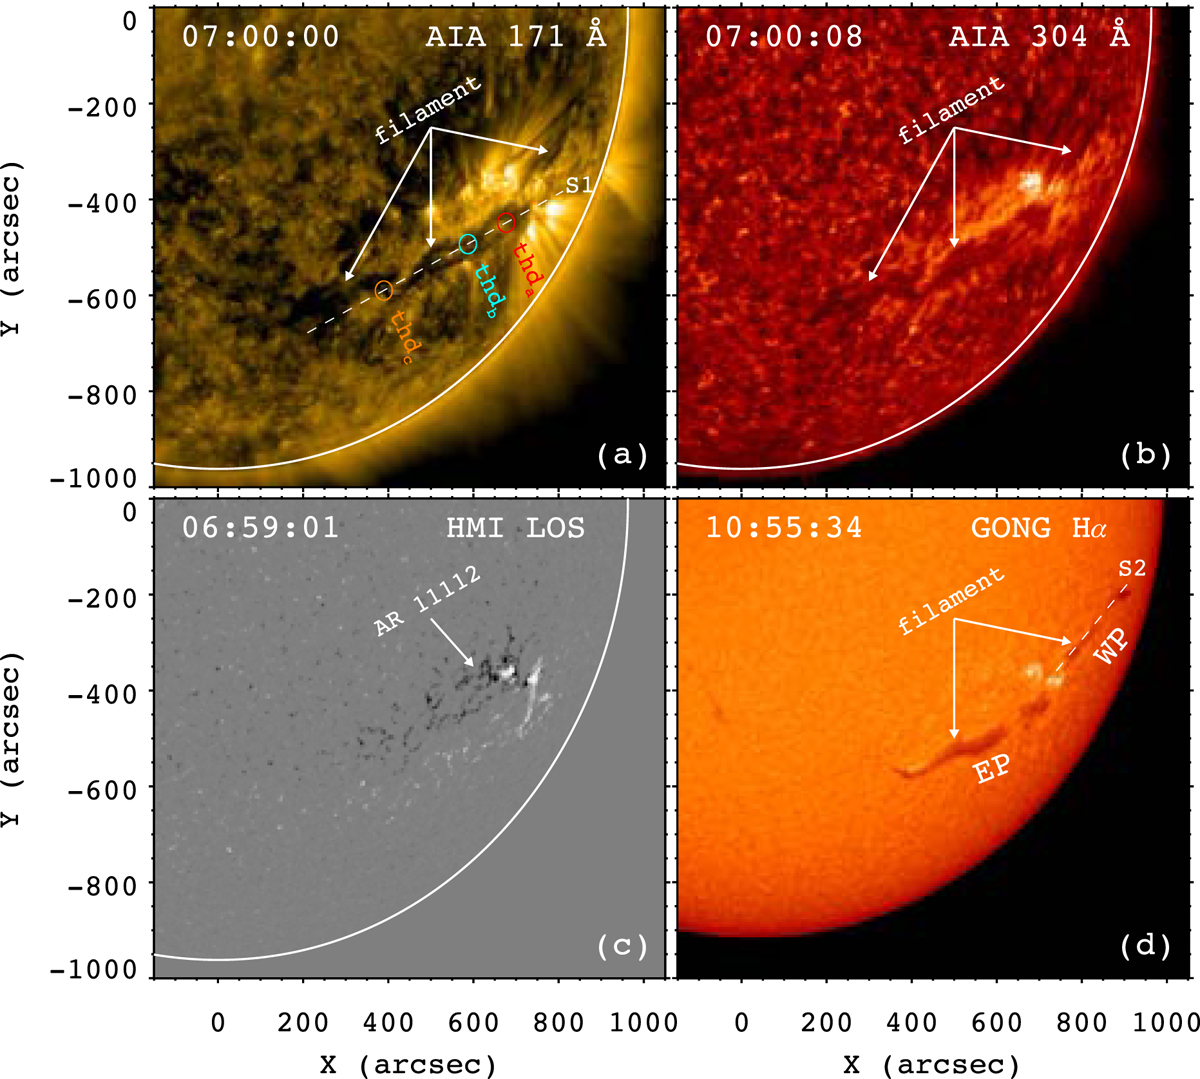
Panels a–b: AIA 171 and 304 Å images at 07:00 UT. The arrows point to the long filament. Panel c: HMI LOS magnetogram at 06:59 UT. The arrow points to AR 11112. Panel d: GONG Hα image at 10:55:34 UT. “EP” and “WP” represent the eastern and western parts of the filament, respectively. In panel a a slice (S1) is selected to investigate the longitudinal oscillations of EP, whose time-distance diagram is shown in Fig. 10. The red, cyan, and orange circles indicate the oscillating threads (thda, thdb, and thdc) in EP. In panel d a slice (S2) is selected to investigate the evolution of WP, whose time-distance diagram is shown in Fig. 5.
Current usage metrics show cumulative count of Article Views (full-text article views including HTML views, PDF and ePub downloads, according to the available data) and Abstracts Views on Vision4Press platform.
Data correspond to usage on the plateform after 2015. The current usage metrics is available 48-96 hours after online publication and is updated daily on week days.
Initial download of the metrics may take a while.