Fig. 6.
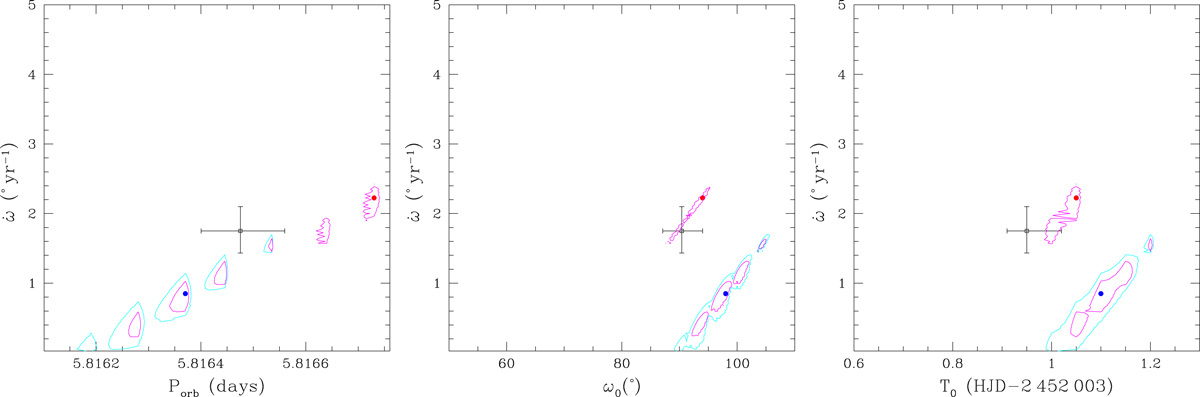
Contours of χ2 of the overall fits of the photometric data. The blue and red dots correspond to the best fits for the entire set of V, y and c2-band data, and to the V and y data alone, respectively. The cyan and magenta contours provide the corresponding confidence levels for the full dataset and for the sole V and y data, respectively. The open square with error bars corresponds to our best-fit result of the equivalent RV data.
Current usage metrics show cumulative count of Article Views (full-text article views including HTML views, PDF and ePub downloads, according to the available data) and Abstracts Views on Vision4Press platform.
Data correspond to usage on the plateform after 2015. The current usage metrics is available 48-96 hours after online publication and is updated daily on week days.
Initial download of the metrics may take a while.