Fig. 5.
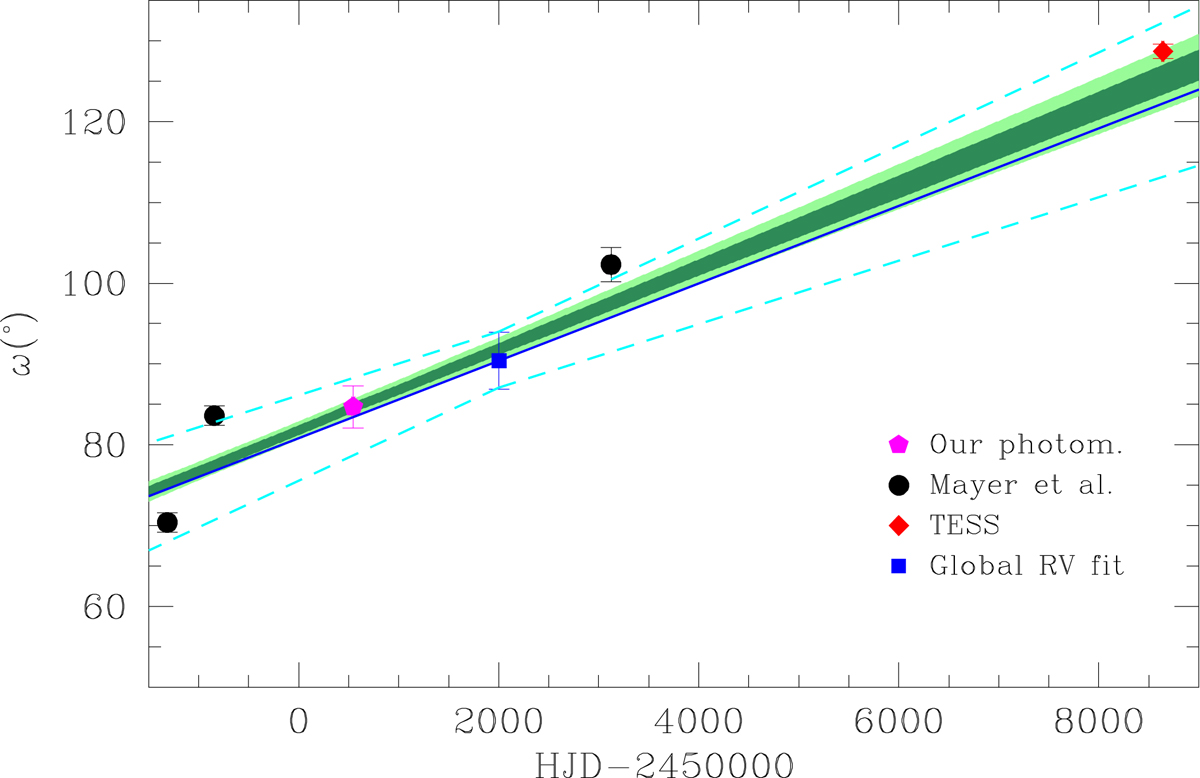
Values of ω as a function of time inferred from the photometric light curves and the RVs. The black filled dots correspond to the data of the fits of the UBV photometry from Mayer et al. (2008) (the first three lines of Table 6), the pink filled dot corresponds to the fit of the c2 light curve (penultimate line of Table 6), the red filled square corresponds to the data of the fits of the TESS photometry (last line of Table 6), and the blue filled square indicates the ω0 value obtained from the global fit of all RV data. The solid blue line corresponds to our best value of ![]() from the equivalent RVs, and the dashed cyan lines corresponds to the range of values according to the 1σ uncertainties on ω0 and
from the equivalent RVs, and the dashed cyan lines corresponds to the range of values according to the 1σ uncertainties on ω0 and ![]() (Table 4). In dark green and light green we represent the 1σ and 2σ uncertainties on ω(t) from the posteriors for ω and
(Table 4). In dark green and light green we represent the 1σ and 2σ uncertainties on ω(t) from the posteriors for ω and ![]() as shown in Fig. 7 (see PHOEBE analysis in Sect. 6). The PHOEBE model is fit directly to the observations, not to the estimates shown in this figure.
as shown in Fig. 7 (see PHOEBE analysis in Sect. 6). The PHOEBE model is fit directly to the observations, not to the estimates shown in this figure.
Current usage metrics show cumulative count of Article Views (full-text article views including HTML views, PDF and ePub downloads, according to the available data) and Abstracts Views on Vision4Press platform.
Data correspond to usage on the plateform after 2015. The current usage metrics is available 48-96 hours after online publication and is updated daily on week days.
Initial download of the metrics may take a while.