Fig. 2.
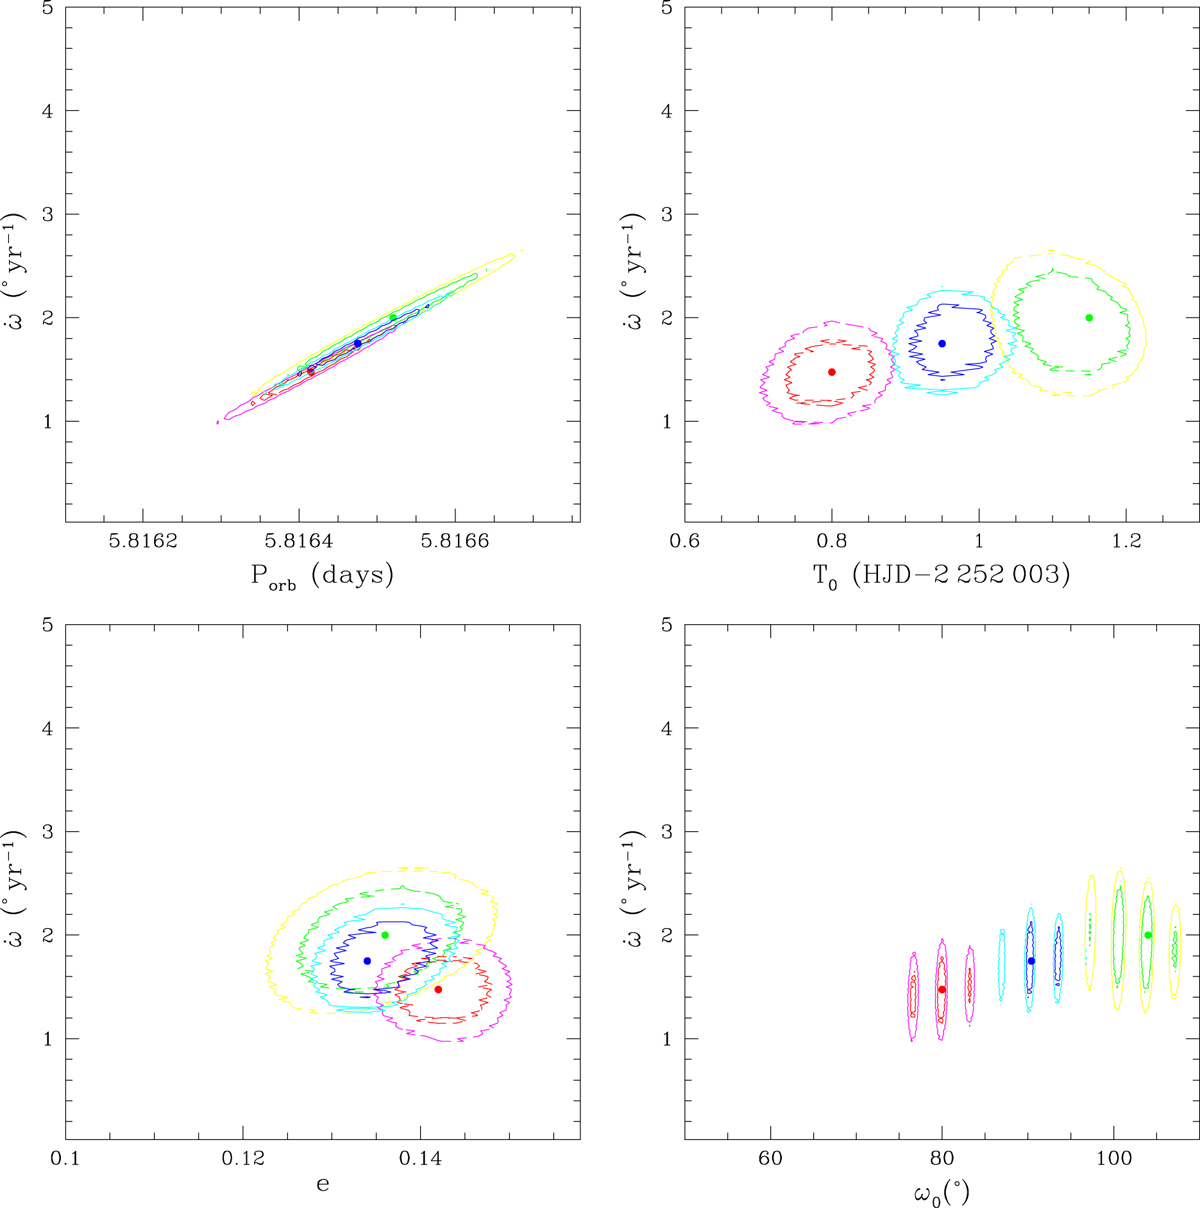
Confidence contours for the best-fit parameters obtained from the adjustment of the full set of 143 RV data with Eqs. (10) and (11). The best-fit solutions for the primary, secondary, and equivalent RVs are shown by the red, green, and blue filled dots. The corresponding 1σ and 90% confidence levels are shown by the red and magenta, green and yellow, and blue and cyan contours for the primary, secondary, and equivalent RVs, respectively.
Current usage metrics show cumulative count of Article Views (full-text article views including HTML views, PDF and ePub downloads, according to the available data) and Abstracts Views on Vision4Press platform.
Data correspond to usage on the plateform after 2015. The current usage metrics is available 48-96 hours after online publication and is updated daily on week days.
Initial download of the metrics may take a while.