Free Access
Fig. D.1.
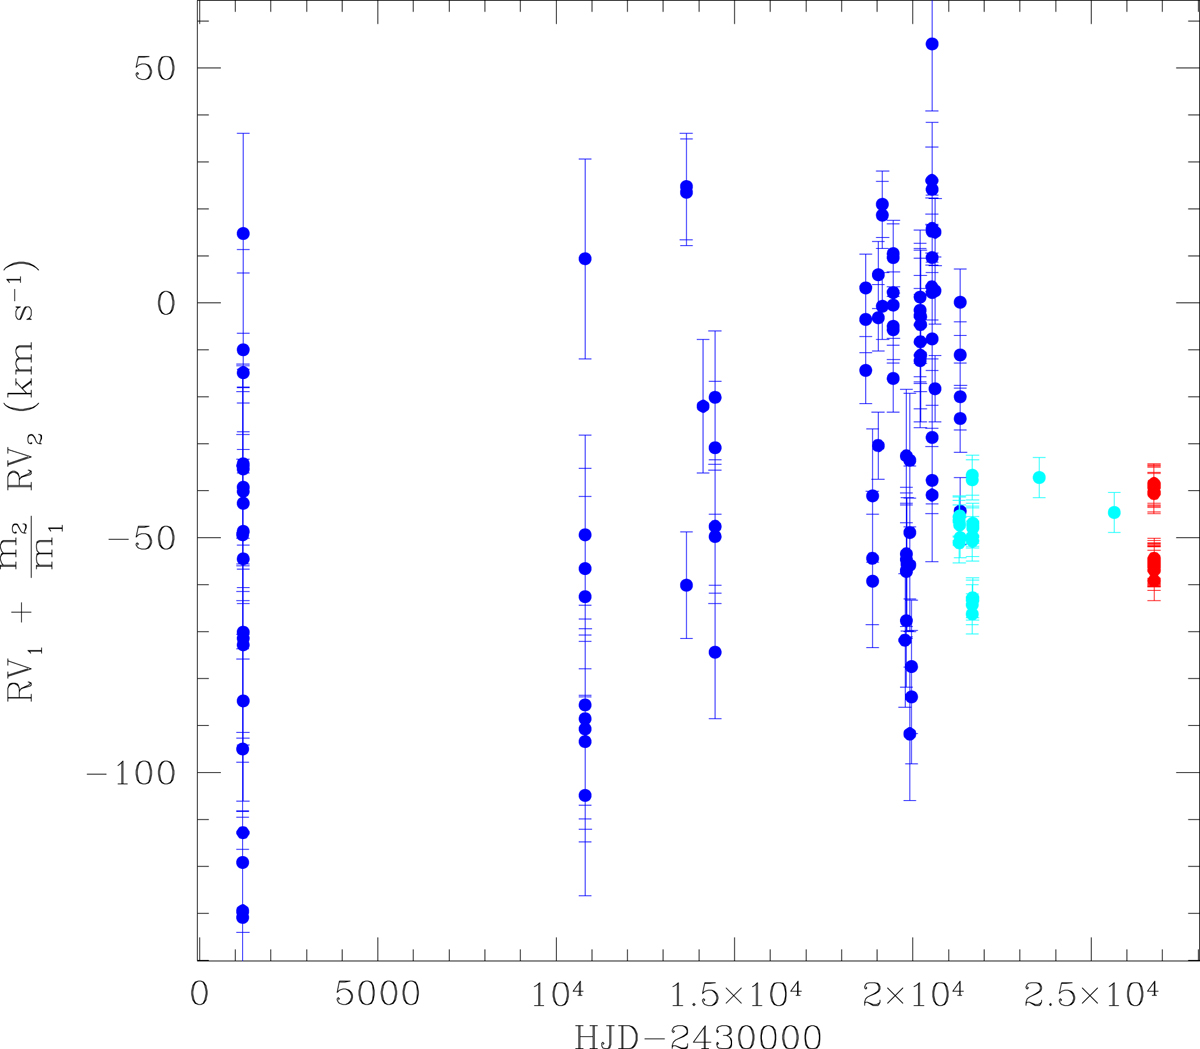
Sum of the RV of the primary star and RV of the secondary star times the mass ratio for all spectroscopic observations as computed from Eq. (D.1). The FEROS data are plotted in cyan, the ESPaDOns data in red, and all other data in blue.
Current usage metrics show cumulative count of Article Views (full-text article views including HTML views, PDF and ePub downloads, according to the available data) and Abstracts Views on Vision4Press platform.
Data correspond to usage on the plateform after 2015. The current usage metrics is available 48-96 hours after online publication and is updated daily on week days.
Initial download of the metrics may take a while.