Fig. 6
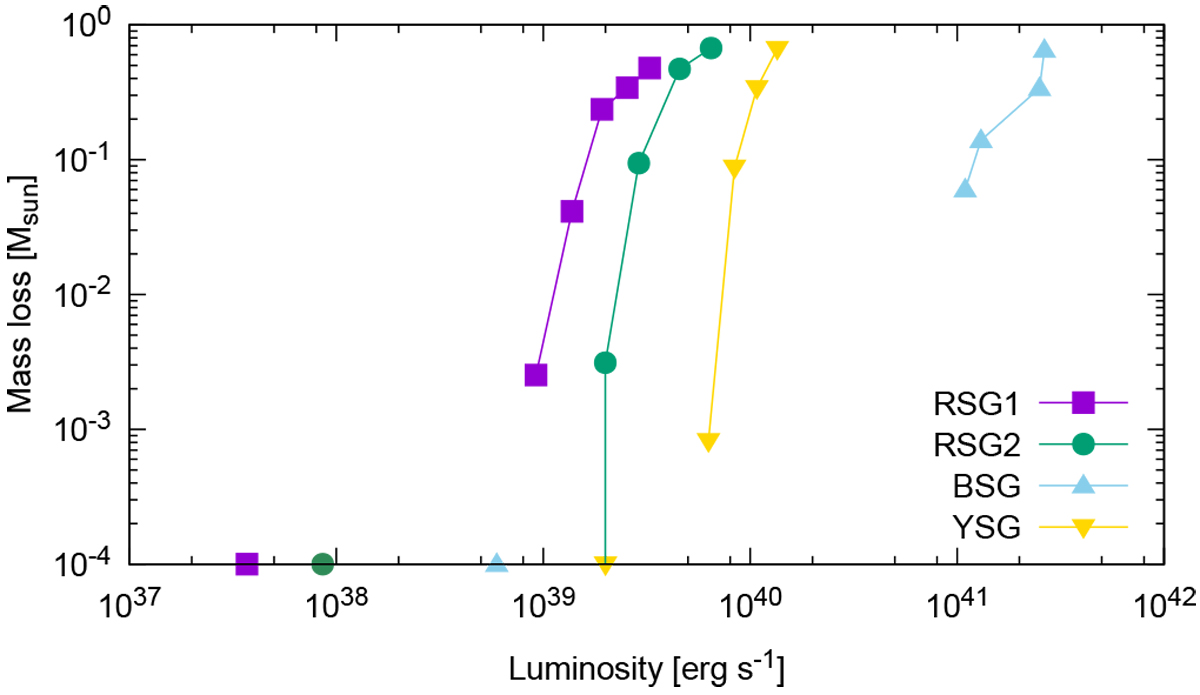
Relation between the peak luminosity and the amount of mass loss for each model with different amounts of injected energy shown in Table 2. As mentioned at the beginning of Sect. 3, we are not able to obtain the light curve for model WR1 and WR2 and, thus, these models are absent from this figure. Symbols on the horizontal axis in this figure represent the luminosity before the arrival of outward-moving shock or diffusing photons at the photosphere.
Current usage metrics show cumulative count of Article Views (full-text article views including HTML views, PDF and ePub downloads, according to the available data) and Abstracts Views on Vision4Press platform.
Data correspond to usage on the plateform after 2015. The current usage metrics is available 48-96 hours after online publication and is updated daily on week days.
Initial download of the metrics may take a while.