Fig. 1
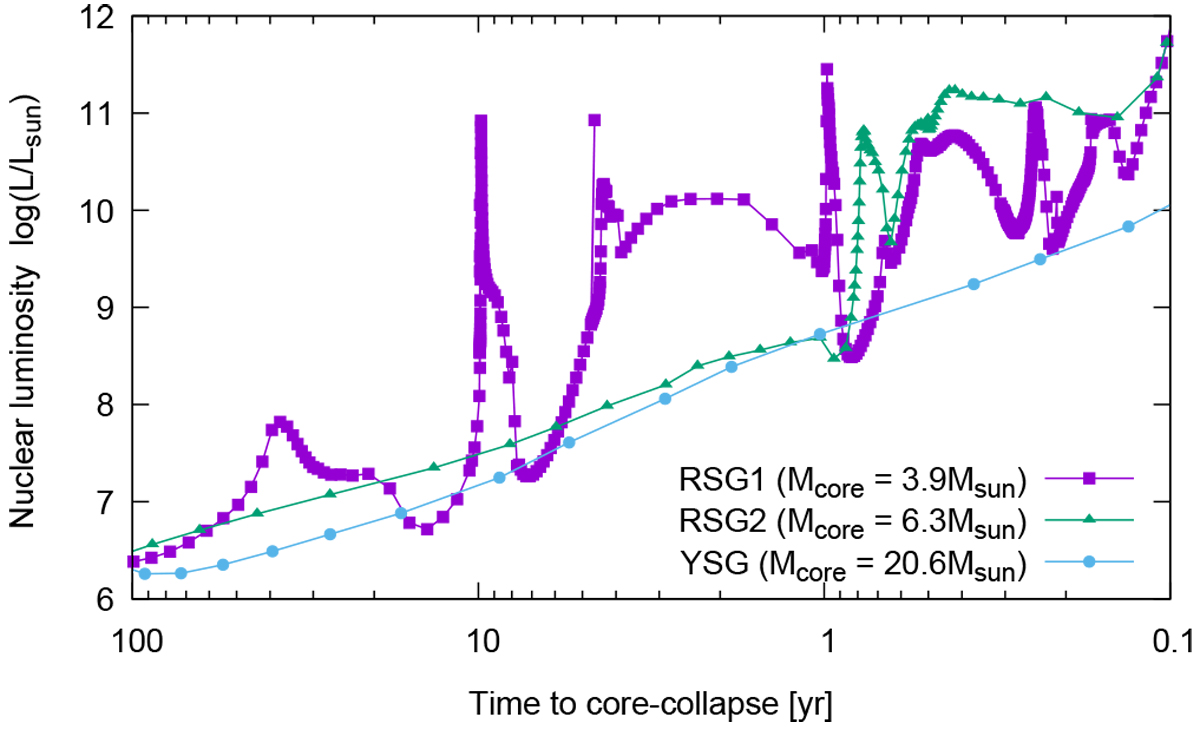
Time evolution of nuclear burning luminosity excluding neutrino emission for each model. Details about each model are given in Sect. 2.1. A more massive star has a shorter timescale of burning, and therefore each burning stage starts at the moment closer to the time of core collapse. In this figure, RSG1 and RSG2 experience a sudden increase of nuclear burning luminosity because of the beginning of the core neon burning at about ten and 0.8 yr before core collapse, respectively. On the other hand, for model YSG, central carbon burning still continues at 0.1 yr before core collapse.
Current usage metrics show cumulative count of Article Views (full-text article views including HTML views, PDF and ePub downloads, according to the available data) and Abstracts Views on Vision4Press platform.
Data correspond to usage on the plateform after 2015. The current usage metrics is available 48-96 hours after online publication and is updated daily on week days.
Initial download of the metrics may take a while.