Fig. 5.
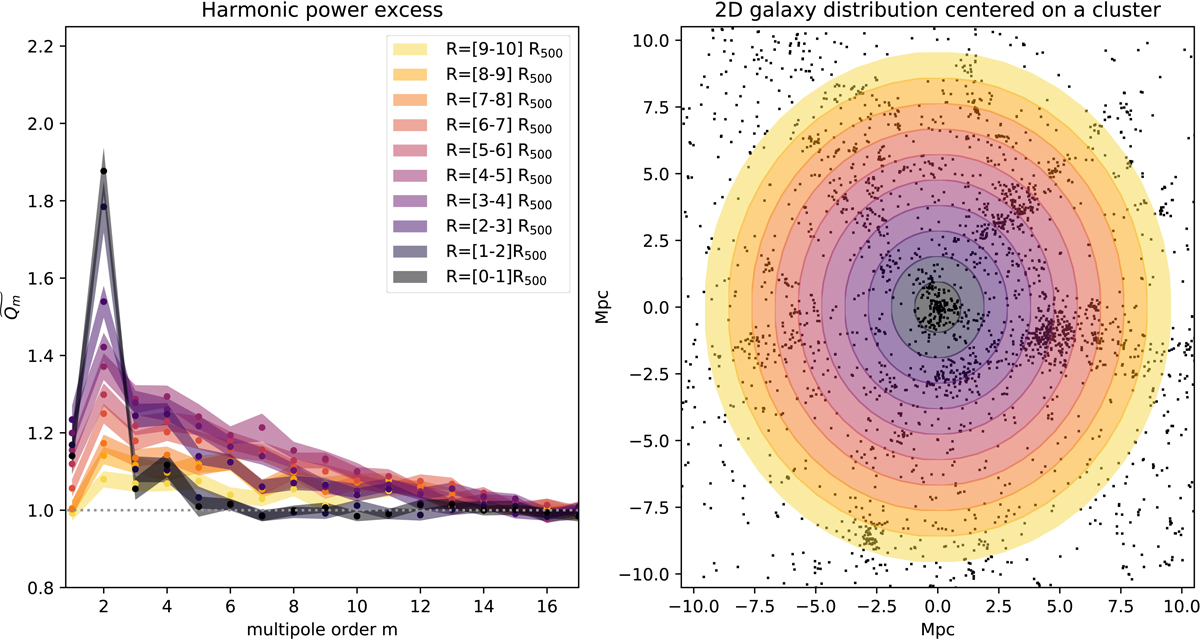
Left panel: harmonic power excess ![]() for multipole order m from 1 to 17, as a function of different cluster-centric apertures. This is computed by averaging the multipolar moments of the galaxy distribution in Case 3. Error bars are the error on the mean computed from bootstrap re-sampling. Right panel: illustration of the different apertures from cluster centre ([0 − 1]R500) to cluster outskirts ([9 − 10]R500). The projected galaxy distribution around one given mock cluster (M500 ∼ 1.3 × 10¹⁴ M⊙ and z ∼ 0.44) integrated along a redshift slice (Δz = 0.06) centred on cluster redshift is represented with black points.
for multipole order m from 1 to 17, as a function of different cluster-centric apertures. This is computed by averaging the multipolar moments of the galaxy distribution in Case 3. Error bars are the error on the mean computed from bootstrap re-sampling. Right panel: illustration of the different apertures from cluster centre ([0 − 1]R500) to cluster outskirts ([9 − 10]R500). The projected galaxy distribution around one given mock cluster (M500 ∼ 1.3 × 10¹⁴ M⊙ and z ∼ 0.44) integrated along a redshift slice (Δz = 0.06) centred on cluster redshift is represented with black points.
Current usage metrics show cumulative count of Article Views (full-text article views including HTML views, PDF and ePub downloads, according to the available data) and Abstracts Views on Vision4Press platform.
Data correspond to usage on the plateform after 2015. The current usage metrics is available 48-96 hours after online publication and is updated daily on week days.
Initial download of the metrics may take a while.