Fig. 4.
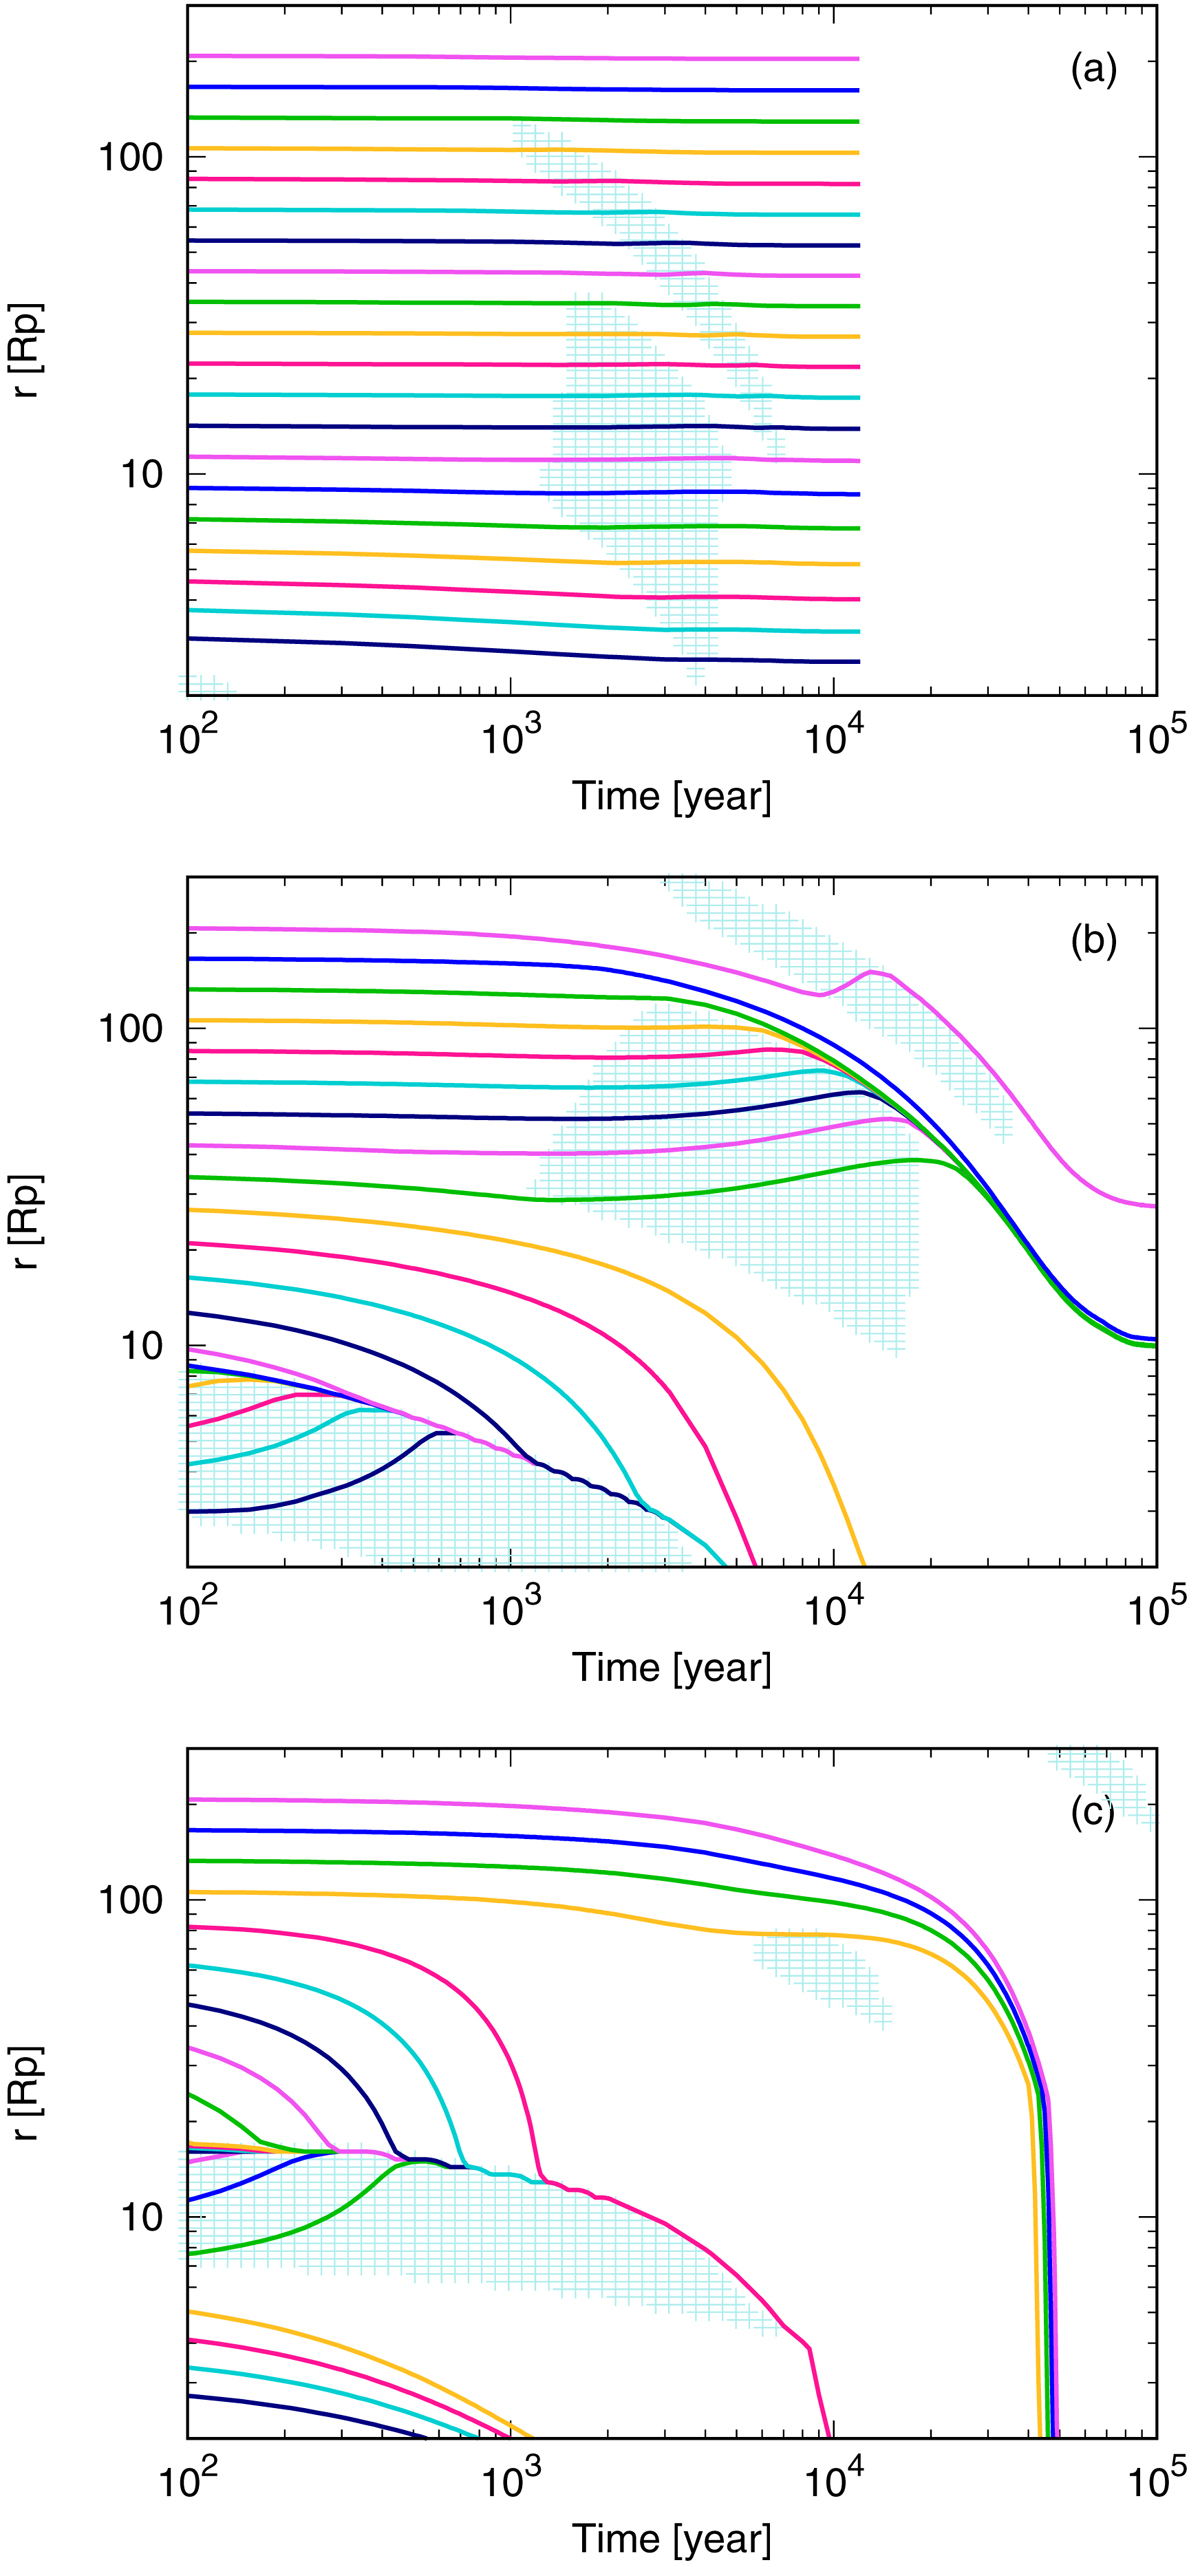
Orbital evolution of individual moons since the disk dissipation started with various initial locations in the case where α = 10−3, α = 10−4 and α = 10−5from top to bottom. The vertical axis is normalized by the planet radius. The shaded areas show when and where β > 0 for Titan mass moons, which correspond to the red regions in Fig. 3. The mutual interactions of satellites are not considered in these plots.
Current usage metrics show cumulative count of Article Views (full-text article views including HTML views, PDF and ePub downloads, according to the available data) and Abstracts Views on Vision4Press platform.
Data correspond to usage on the plateform after 2015. The current usage metrics is available 48-96 hours after online publication and is updated daily on week days.
Initial download of the metrics may take a while.