Free Access
Fig. 3.
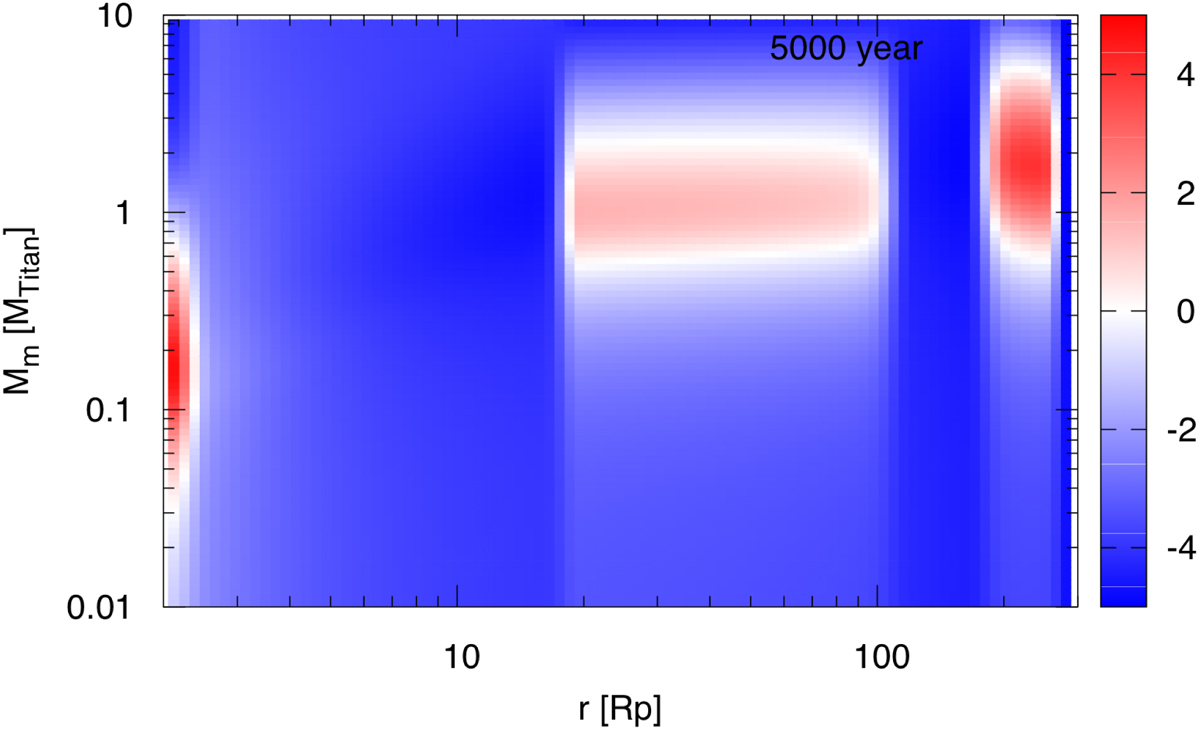
Migration map for a disk with α = 10−4 at 5000 years after the dissipation has started (corresponding to the green lines in Fig. 2). The color bar shows the value of β/(1 + 0.04 K). The direction of a migration is inward/outward in the blue/red region.
Current usage metrics show cumulative count of Article Views (full-text article views including HTML views, PDF and ePub downloads, according to the available data) and Abstracts Views on Vision4Press platform.
Data correspond to usage on the plateform after 2015. The current usage metrics is available 48-96 hours after online publication and is updated daily on week days.
Initial download of the metrics may take a while.