Fig. 9.
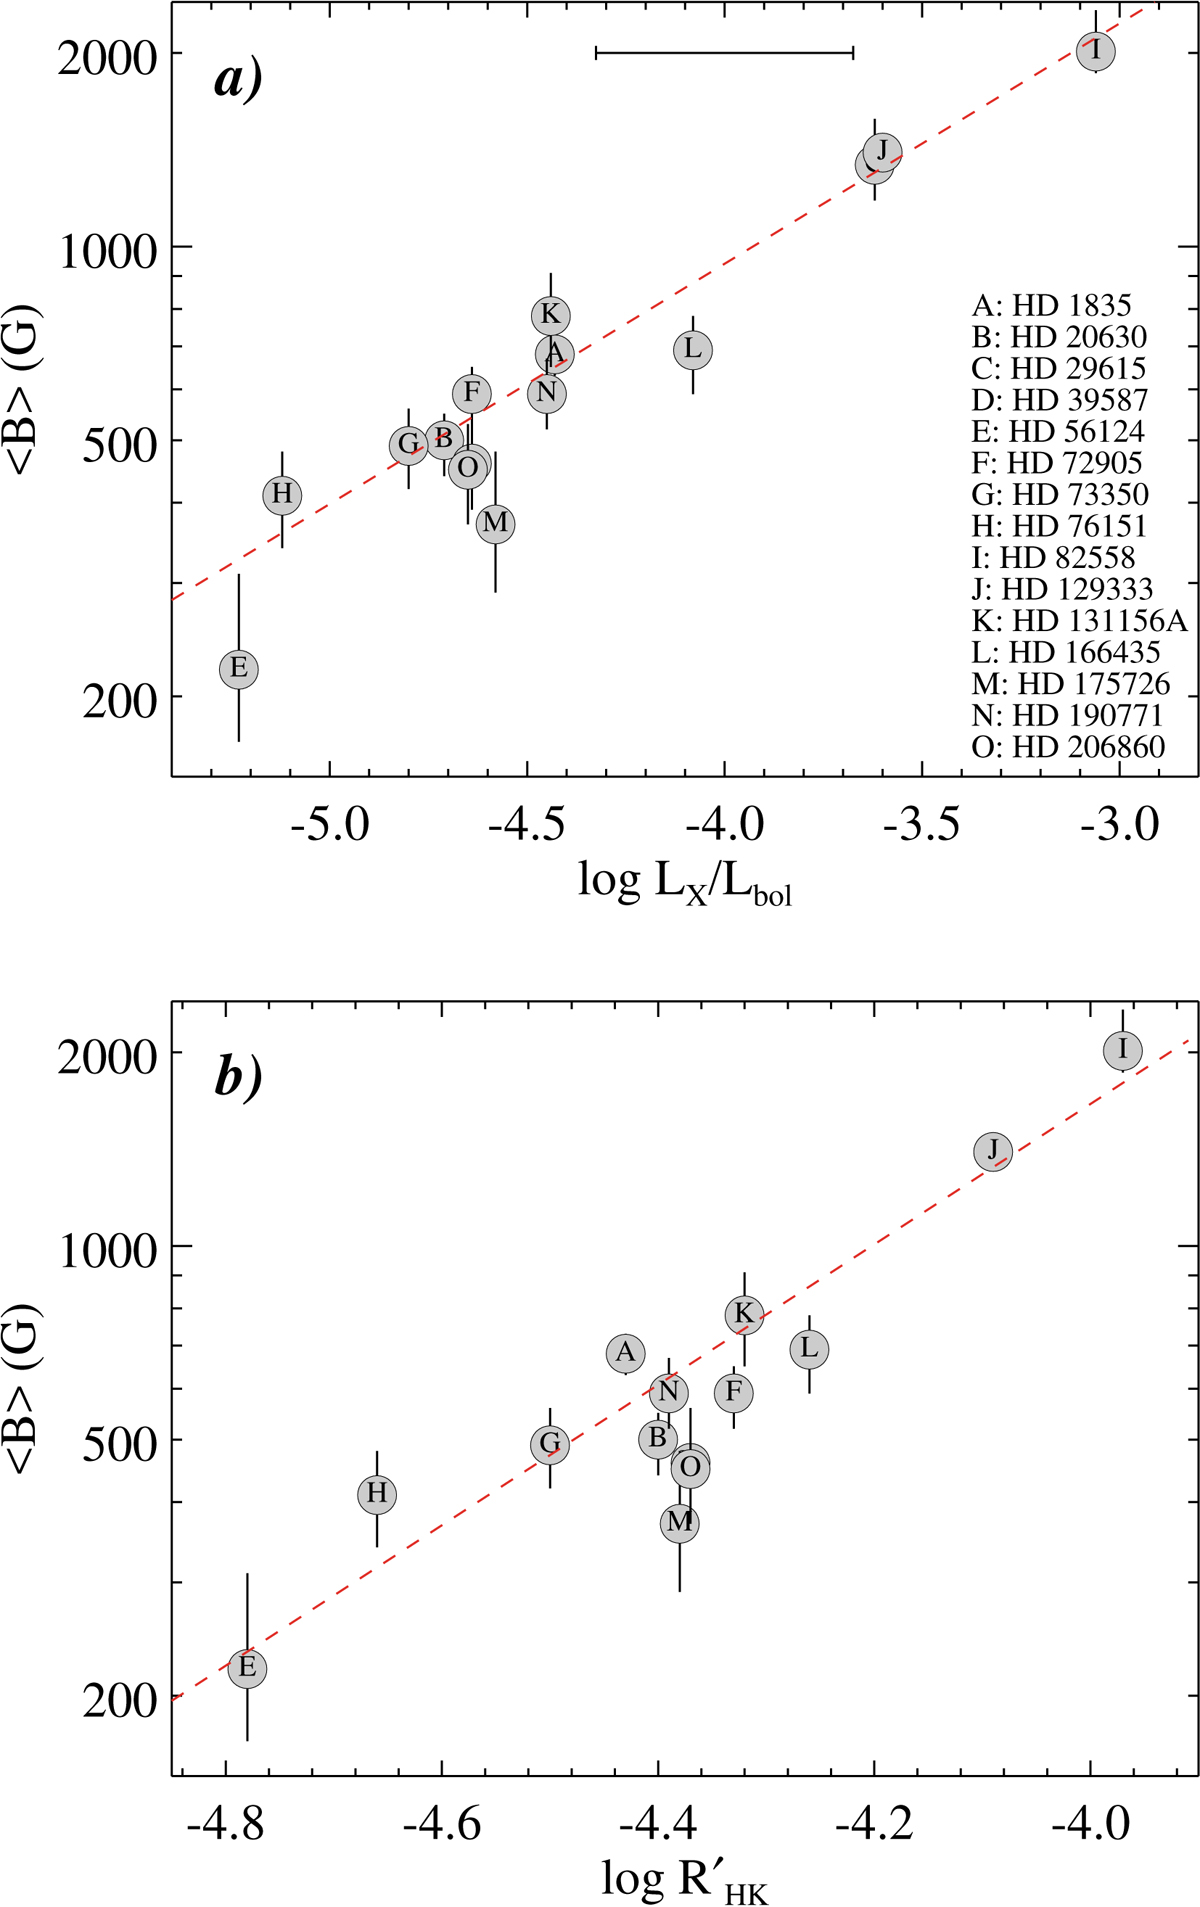
Panel a: correlation between the total magnetic field strength and X-ray-to-bolometric luminosity ratio log LX/Lbol. Individual targets are identified with Latin letters. The dashed line shows the best fitting power-law relation ⟨B⟩∝(LX/Lbol)0.37. The horizontal bar at the top illustrates typical variation of log LX/Lbol over stellar activity cycles. Panel b: correlation between the total magnetic field strength and the Ca HK emission measure log ![]() . The dashed line corresponds to the best fitting relation
. The dashed line corresponds to the best fitting relation ![]() .
.
Current usage metrics show cumulative count of Article Views (full-text article views including HTML views, PDF and ePub downloads, according to the available data) and Abstracts Views on Vision4Press platform.
Data correspond to usage on the plateform after 2015. The current usage metrics is available 48-96 hours after online publication and is updated daily on week days.
Initial download of the metrics may take a while.