Fig. 6.
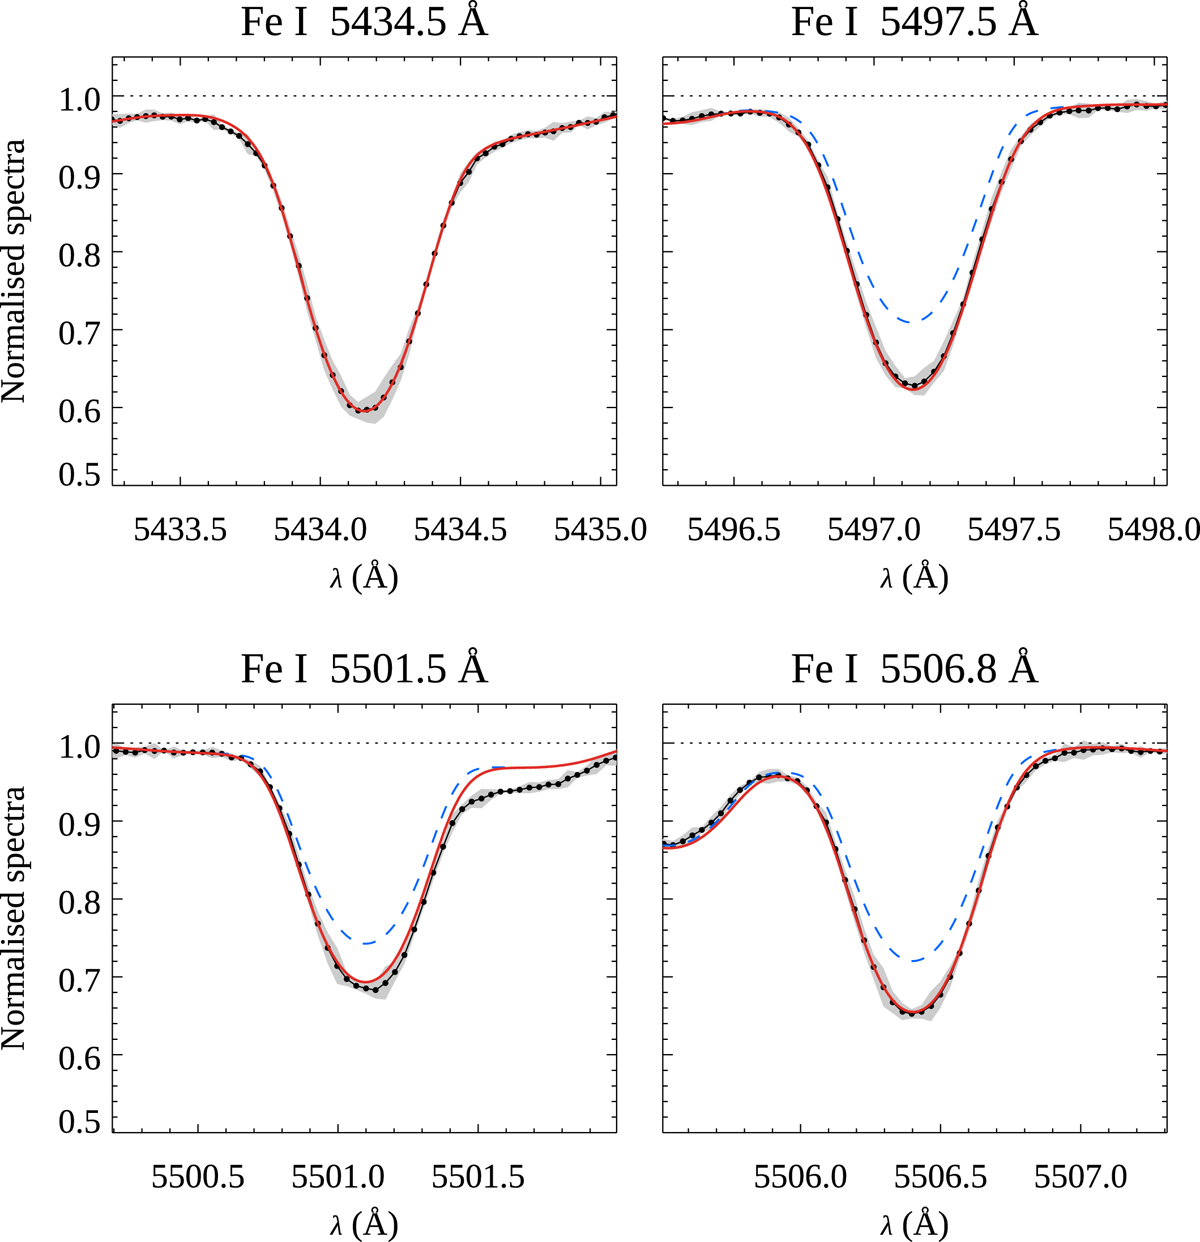
Magnetic field measurement for HD 129333 (2009.02 epoch). The average observed profiles of the four Fe I lines are shown with black symbols connected by thin solid lines. The grey curve in the background corresponds to ± twice the standard deviation for each pixel of the observed spectra. The thick red solid line shows theoretical spectrum for the magnetic model yielding the lowest χ2 according to Fig. 5. The dashed blue line shows the corresponding non-magnetic spectrum.
Current usage metrics show cumulative count of Article Views (full-text article views including HTML views, PDF and ePub downloads, according to the available data) and Abstracts Views on Vision4Press platform.
Data correspond to usage on the plateform after 2015. The current usage metrics is available 48-96 hours after online publication and is updated daily on week days.
Initial download of the metrics may take a while.