Fig. 1.
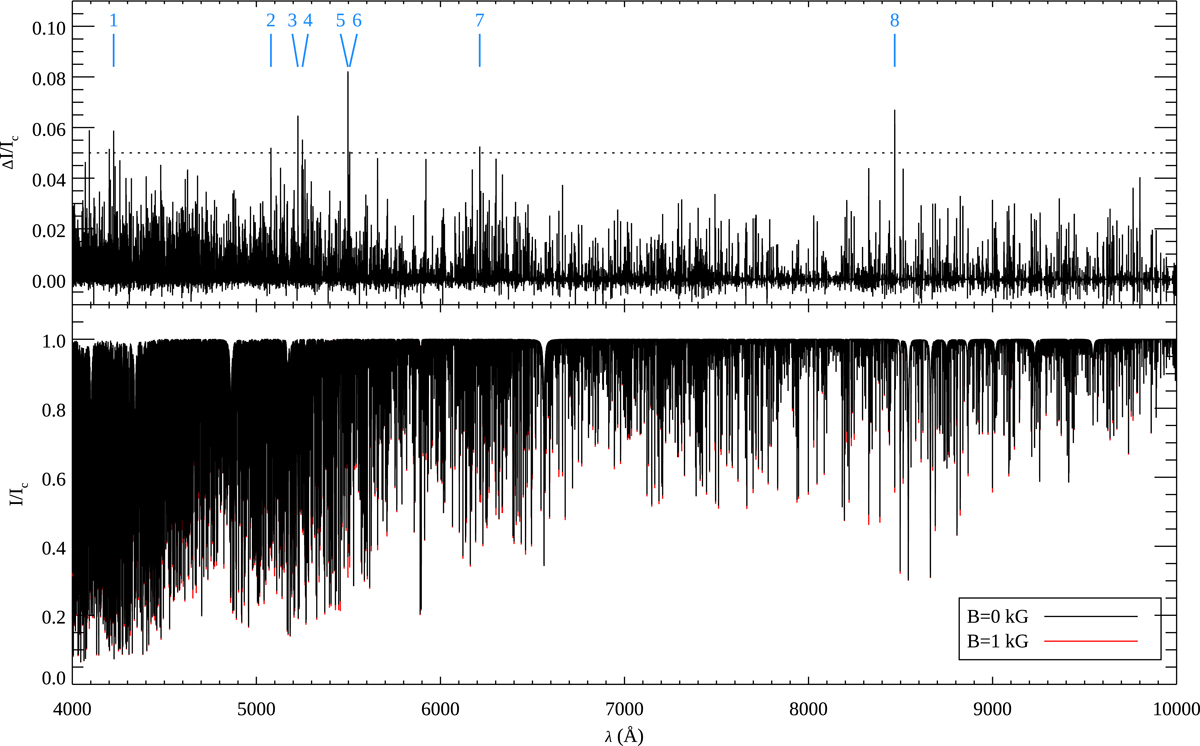
Response of the continuum normalised spectrum in the 4000−10 000 Å wavelength range to a 1 kG magnetic field covering the entire stellar surface. Lower panel: synthetic spectra calculated for the solar atmospheric parameters and abundances with (light curve) and without (dark curve) magnetic field. Upper panel: difference between these two spectra. The lines showing the strongest Zeeman response are identified according to the numbering adopted in Table 1.
Current usage metrics show cumulative count of Article Views (full-text article views including HTML views, PDF and ePub downloads, according to the available data) and Abstracts Views on Vision4Press platform.
Data correspond to usage on the plateform after 2015. The current usage metrics is available 48-96 hours after online publication and is updated daily on week days.
Initial download of the metrics may take a while.