Fig. 7
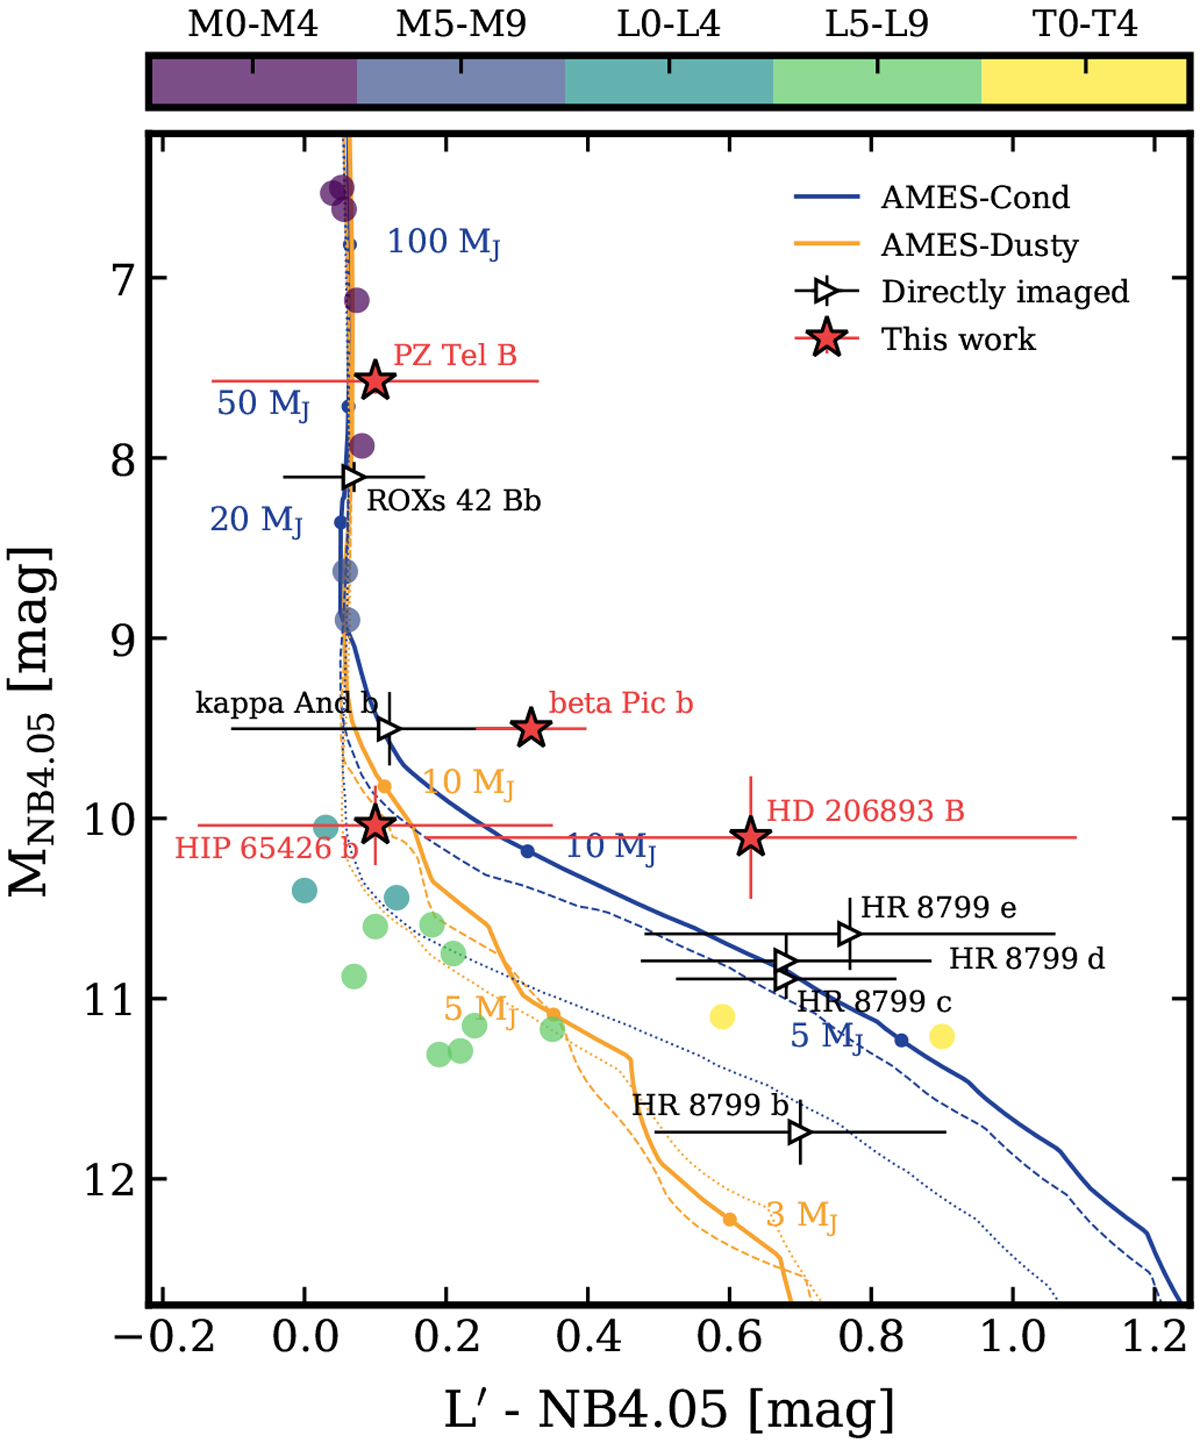
Color–magnitude diagram L′–NB4.05 vs. MNB4.05. The photometry and colors of the M, L, and T dwarfs were derived from IRTF (Cushing et al. 2005) and AKARI spectra (Currie et al. 2014). The field objects are color coded according to their spectral type (see discrete color bar) and the directly imaged companions are labeled individually. The companions from this study are highlighted with a red star. The blue and orange lines show the synthetic colors and magnitudes computed from the AMES-Cond and AMES-Dusty evolutionary tracks for ages of 20 Myr (solid), 100 Myr (dashed), and 1000 Myr (dotted).
Current usage metrics show cumulative count of Article Views (full-text article views including HTML views, PDF and ePub downloads, according to the available data) and Abstracts Views on Vision4Press platform.
Data correspond to usage on the plateform after 2015. The current usage metrics is available 48-96 hours after online publication and is updated daily on week days.
Initial download of the metrics may take a while.