Fig. 5
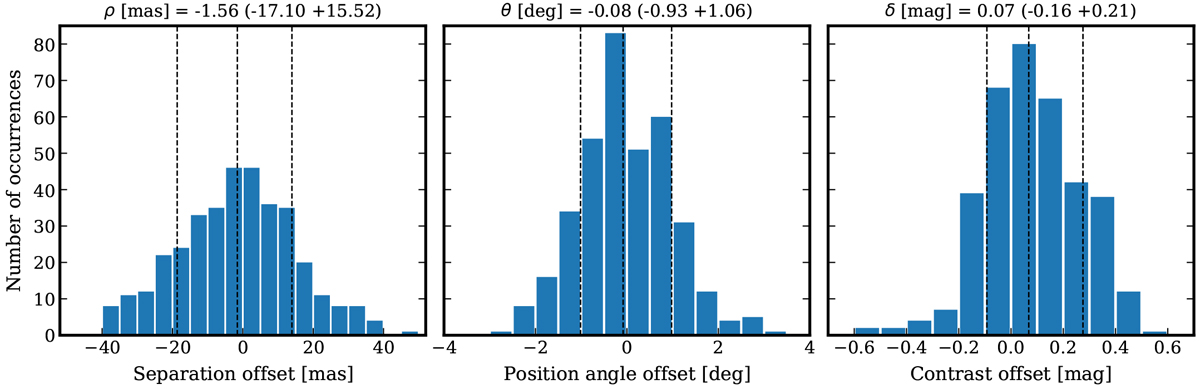
Offset between the injected and retrieved values of the separation (left panel), ρ, position angle (center panel), θ, and flux contrast (right panel), δ, for the NB4.05 dataset of HIP 65426. The precision of the figure of merit was tested at 360 position angles with the best-fit separation and contrast from the MCMC analysis (see Fig. 4). The vertically dashed lines indicate the 16th, 50th, and 84th percentiles of the samples from which the uncertainties in the title above each panel have been derived.
Current usage metrics show cumulative count of Article Views (full-text article views including HTML views, PDF and ePub downloads, according to the available data) and Abstracts Views on Vision4Press platform.
Data correspond to usage on the plateform after 2015. The current usage metrics is available 48-96 hours after online publication and is updated daily on week days.
Initial download of the metrics may take a while.