Fig. 4
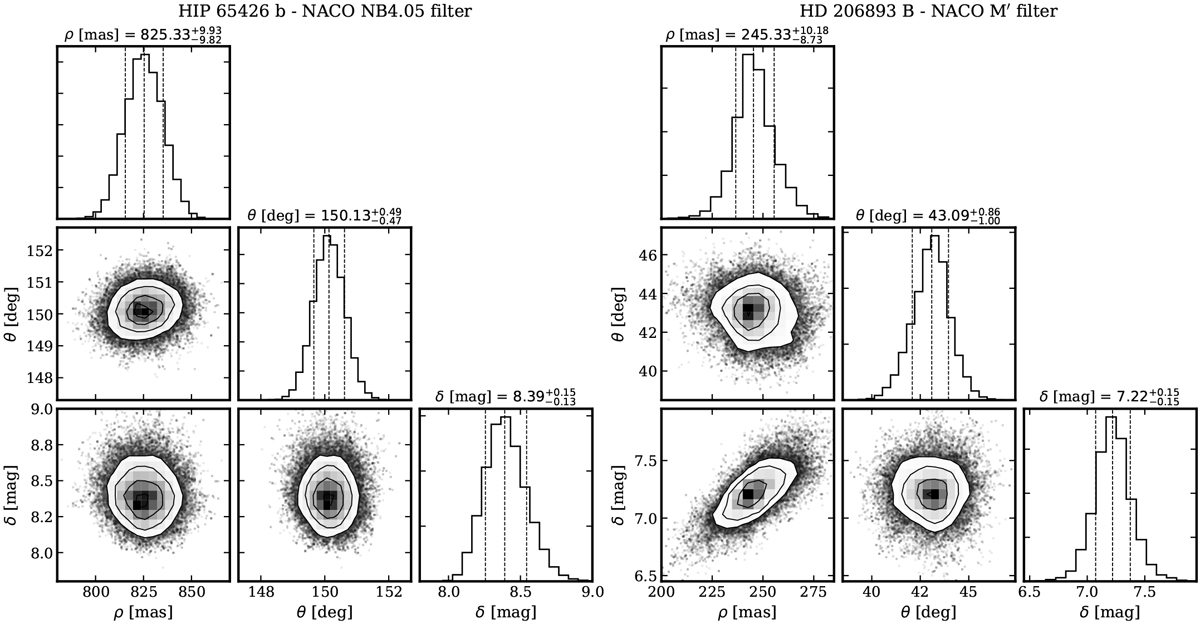
Posterior distributions of the separation, ρ, position angle, θ, and flux contrast, δ, for HIP 65426 b in the NB4.05 filter (left panel) and HD 206893 in the M′ filter (rightpanel). The MCMC results of the remaining targets and filters are displayed in Fig. A.1. Diagonal panels: marginalized 1D distributions of the parameters and off-axis panels: map the 2D probability space for all parameter pairs. The listed values and uncertainties are the median, and the 16th and 84th percentiles of the parameter samples, which are also indicated by the vertically dashed lines in the 1D distributions. Contours overlaid on the 2D distributions correspond to 1σ, 2σ, and 3σ confidence levels for Gaussian statistics.
Current usage metrics show cumulative count of Article Views (full-text article views including HTML views, PDF and ePub downloads, according to the available data) and Abstracts Views on Vision4Press platform.
Data correspond to usage on the plateform after 2015. The current usage metrics is available 48-96 hours after online publication and is updated daily on week days.
Initial download of the metrics may take a while.