Fig. C.1
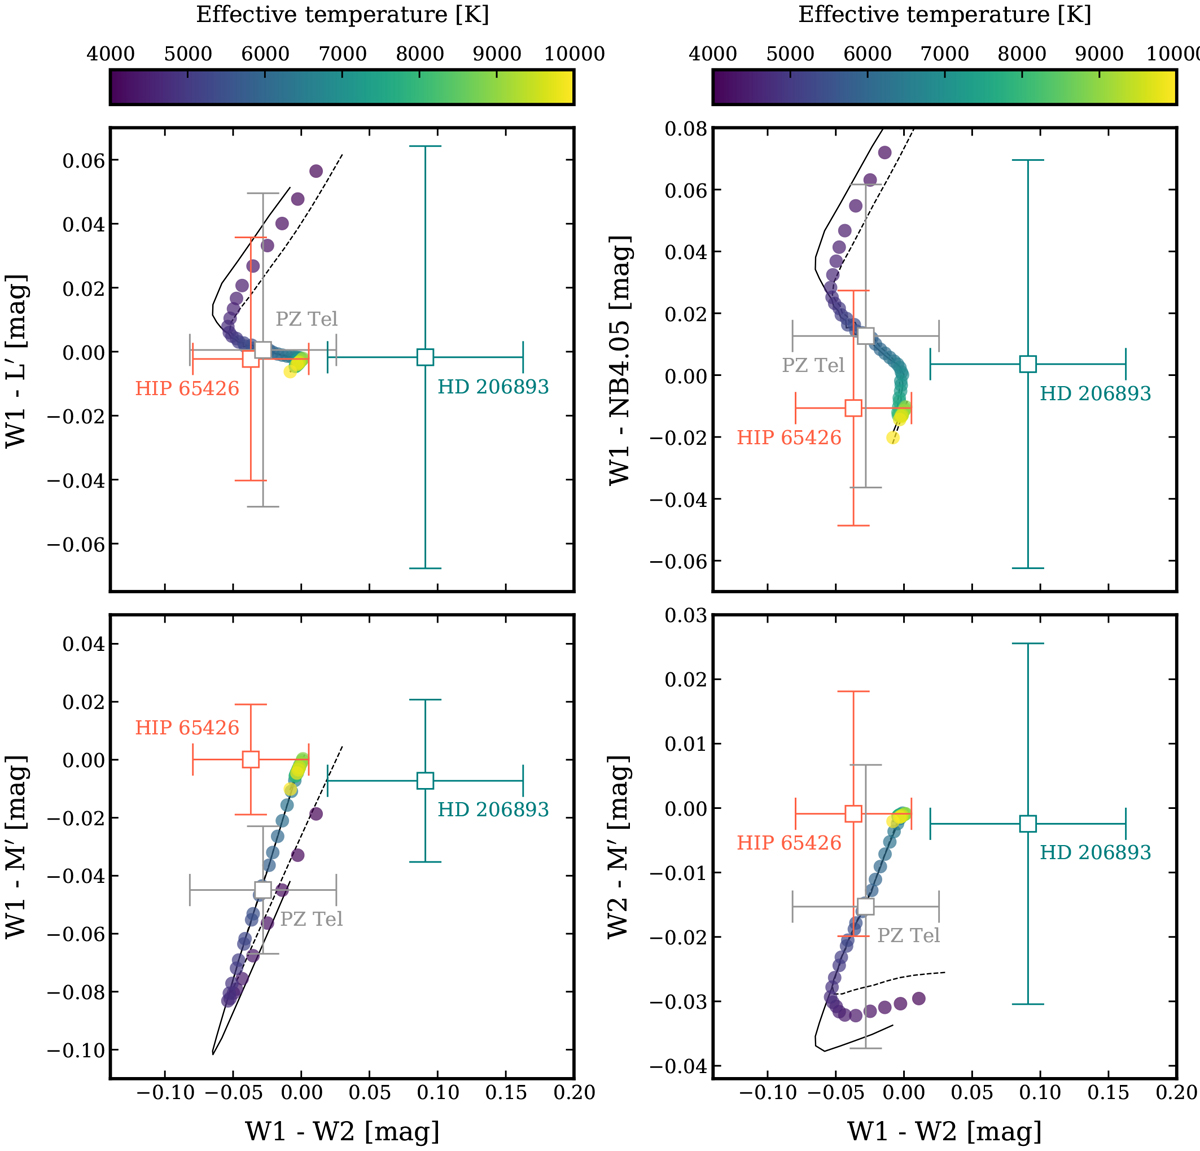
Color–color diagrams of W1–W2 vs. W1–L′ (top left panel), W1–NB4.05 (top right panel), W1–M′ (bottom left panel), and W2–M′ (bottom right panel). The synthetic photometry (colored dots) is calculated for 50 logarithmically spaced temperatures between 4000 and 10 000 K and logg = 4.5 dex. For comparison, the same calculation was done for logg = 4.0 dex (black solid line) and logg = 5.0 dex (black dashed line). The individual data points show the W1–W2 color and uncertainty of HIP 65426, PZ Tel, and HD 206893 along the horizontal axis (see Table 1). Forthe vertical axis, the color was computed from the BT-NextGen models at an effective temperature of 8840 K (HIP 65426; Chauvin et al. 2017), 5665 K (PZ Tel; Schmidt et al. 2014), and 6500 K (HD 206893; Delorme et al. 2017) with the error bars showing the uncertainty on either the W1 or W2 photometry.
Current usage metrics show cumulative count of Article Views (full-text article views including HTML views, PDF and ePub downloads, according to the available data) and Abstracts Views on Vision4Press platform.
Data correspond to usage on the plateform after 2015. The current usage metrics is available 48-96 hours after online publication and is updated daily on week days.
Initial download of the metrics may take a while.