Fig. 13
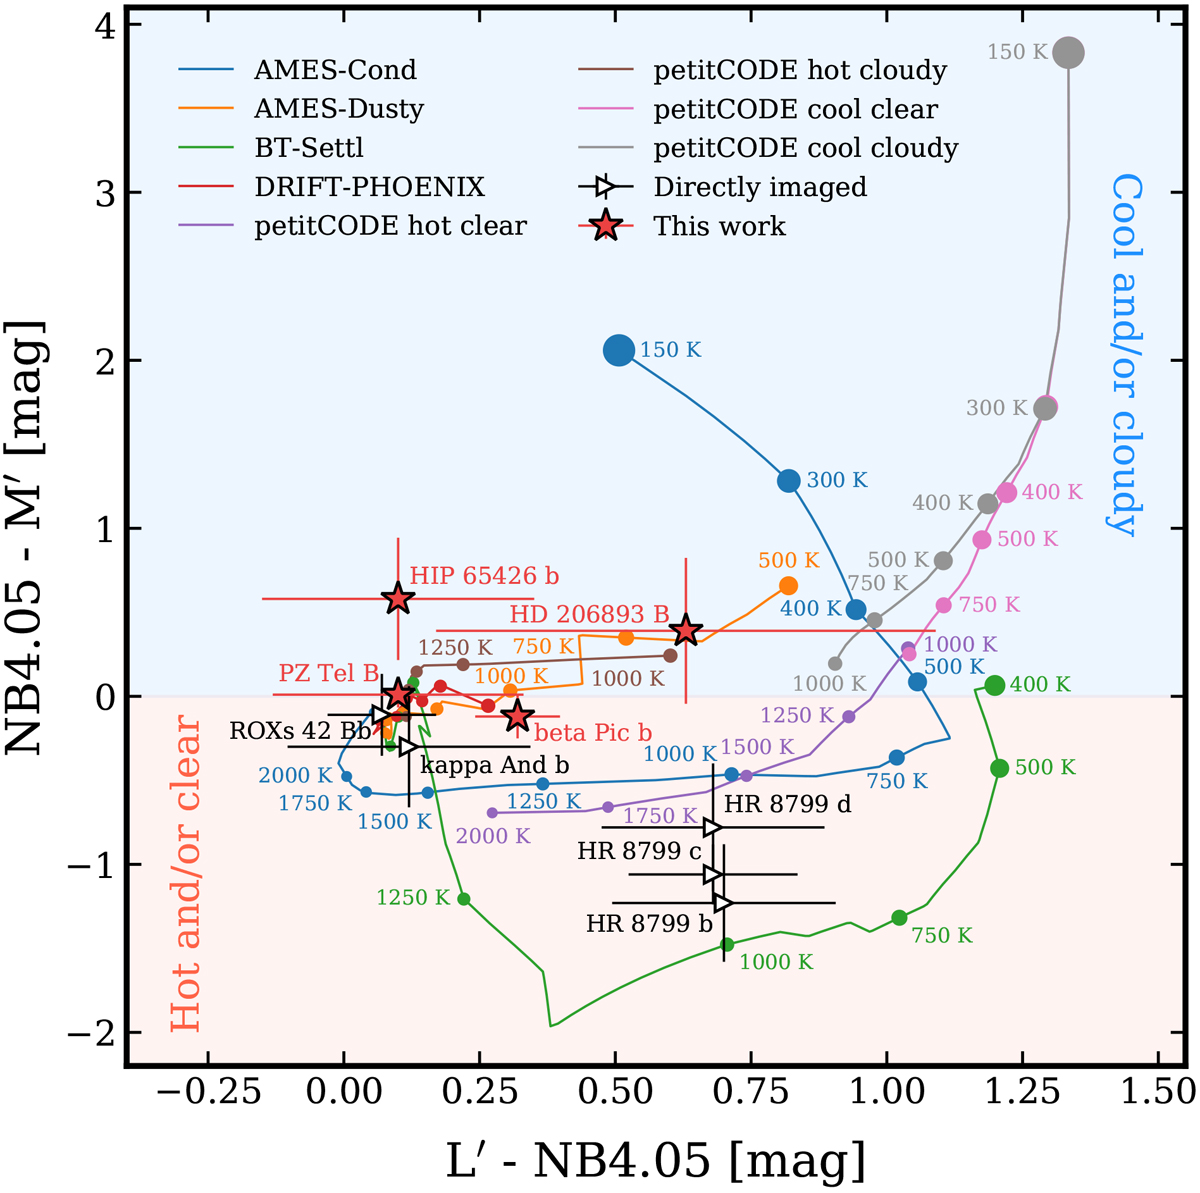
Color–color diagram of L′–NB4.05 vs. NB4.05–M′. Synthetic colors are calculated from the AMES-Cond (Teff = 150-3000 K), AMES-Duty(Teff = 500-3000 K), BT-Settl (Teff = 400-3000 K), DRIFT-PHOENIX (Teff = 1000-3000 K), petitCODE cool (Teff = 150-1000 K), and petitCODE hot (Teff = 1000-2000 K) atmosphericmodels (colored lines) across the indicated temperature range. The other parameters have been fixed to log g =4.0 dex, [Fe∕H] = 0.0 dex, C∕O = 0.55 (only petitCODE), and fsed = 2.0 (only petitCODE cloudy). The dots decrease in size towards higher temperatures and correspond to 150, 300, 400, 500, 750, 1000, 1250, 1500, 1750, 2000, and 3000 K. The directly imaged companions for which photometry is available in the three filters are shown for comparison. The blue and red shaded regions indicate approximately two different NB4.05–M′ regimes.
Current usage metrics show cumulative count of Article Views (full-text article views including HTML views, PDF and ePub downloads, according to the available data) and Abstracts Views on Vision4Press platform.
Data correspond to usage on the plateform after 2015. The current usage metrics is available 48-96 hours after online publication and is updated daily on week days.
Initial download of the metrics may take a while.