Fig. 12
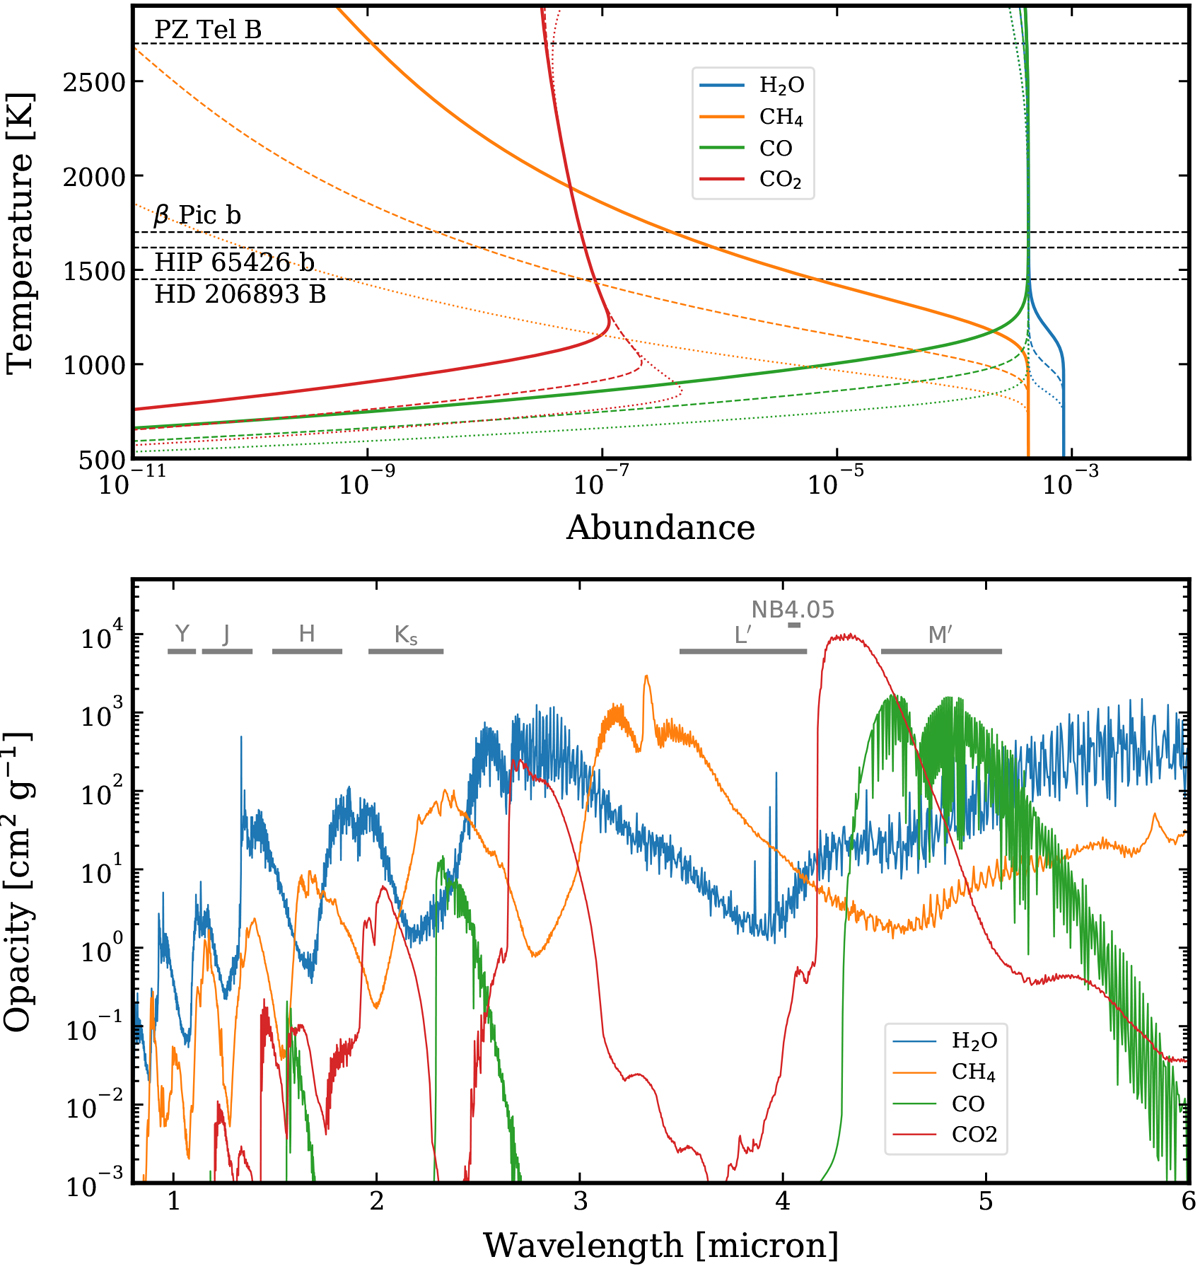
Top panel: chemical equilibrium abundances calculated with rate at 1 bar (solid lines), 100 mbar (dashed lines), and 10 mbar (dotted lines) (Cubillos et al. 2019). For reference, model-dependent effective temperatures of β Pic b (derived in Sect. 4.3) and of the rest of the sample (Maire et al. 2016; Delorme et al. 2017; Cheetham et al. 2019) are indicated by horizontally dashed lines. Bottom panel: molecular opacities calculated with petitRADTRANS at 1 bar and 1500 K (Mollière et al. 2019). Filter bandpasses are indicated with horizontal bars.
Current usage metrics show cumulative count of Article Views (full-text article views including HTML views, PDF and ePub downloads, according to the available data) and Abstracts Views on Vision4Press platform.
Data correspond to usage on the plateform after 2015. The current usage metrics is available 48-96 hours after online publication and is updated daily on week days.
Initial download of the metrics may take a while.