Fig. 11
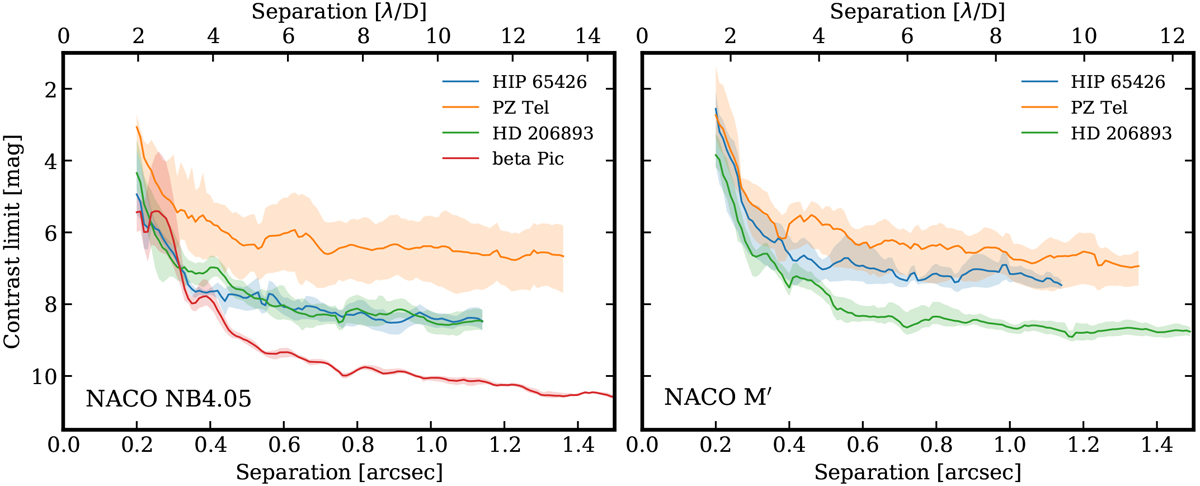
Detection limits derived for the observed targets in the NACO NB4.05 (left panel) and M′ (right panel)filters. The limits for the archival dataset of β Pic b in NB4.05 are also included as a reference. The solid lines show the mean contrast from six values of principal components (PCs) that were tested (5, 10, 15, 20, 25, and 30). The shaded area covers the range between the minimum and maximum detection limit from the different number of PCs. The upper horizontal axis is shown in units of λ∕D, that is, 102 mas in NB4.05 and 120 mas in M′ (at the central wavelengths of the filters).
Current usage metrics show cumulative count of Article Views (full-text article views including HTML views, PDF and ePub downloads, according to the available data) and Abstracts Views on Vision4Press platform.
Data correspond to usage on the plateform after 2015. The current usage metrics is available 48-96 hours after online publication and is updated daily on week days.
Initial download of the metrics may take a while.