Fig. 10
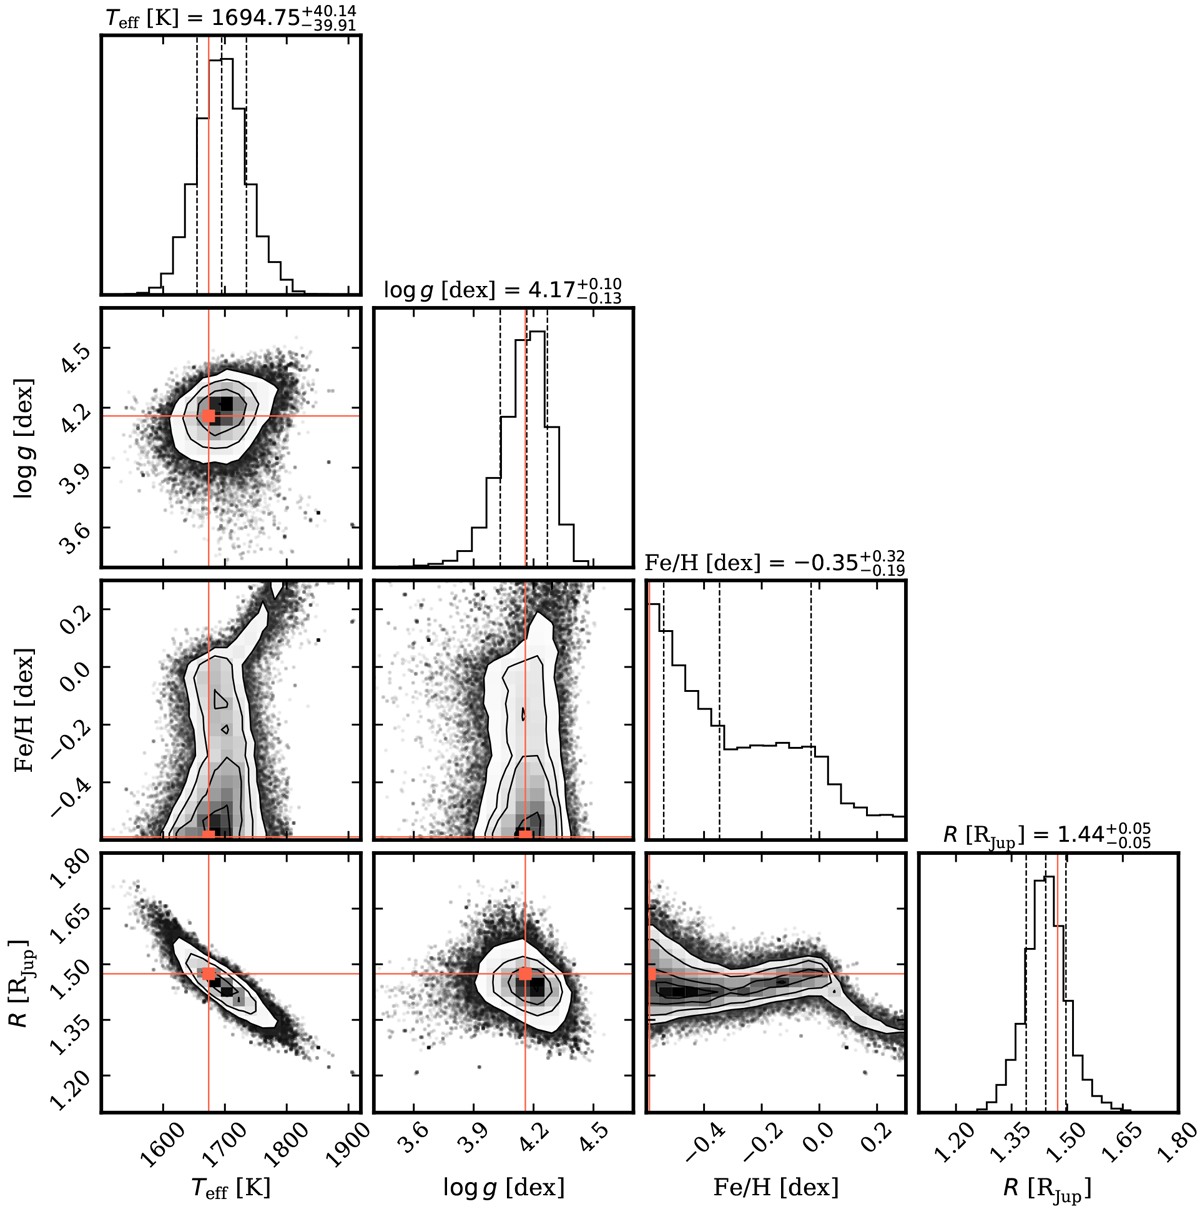
Posterior distributions of the atmospheric model parameters that were fitted to the photometry of β Pic b with a prior on its mass. A comparison of the photometry and the sampled model spectra is shown in Fig. 9. The marginalized 1D and 2D distributions are shown together with the median, and 16th and 84th percentiles of the samples. The red horizontal and vertical lines indicate the sample position with the maximum posterior probability.
Current usage metrics show cumulative count of Article Views (full-text article views including HTML views, PDF and ePub downloads, according to the available data) and Abstracts Views on Vision4Press platform.
Data correspond to usage on the plateform after 2015. The current usage metrics is available 48-96 hours after online publication and is updated daily on week days.
Initial download of the metrics may take a while.